Data on dwindling migratory species

This exercise is a part of Educator Guide: Endangered Migratory Species and A Tiny Toad / View Guide
Five white and black rays are pictured swimming under sunrays filtering through the ocean's surface.
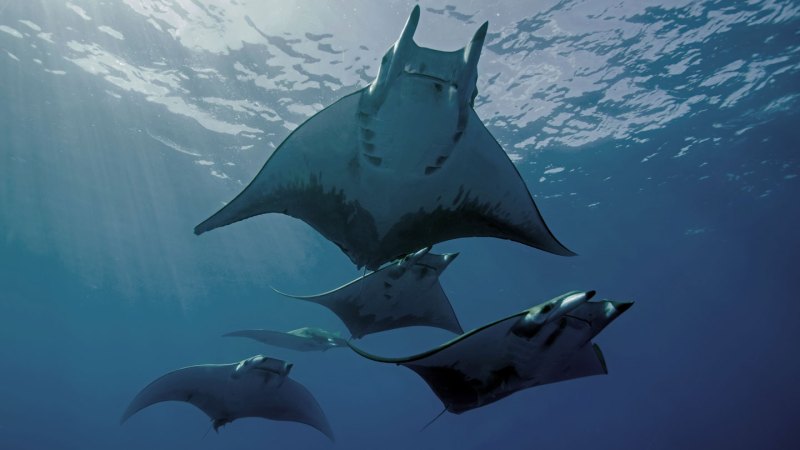
Endangered Chilean devil rays, like the ones shown here, are one of over 50 fish species covered under an international treaty aimed at protecting migratory animals.Gerard Soury/the image bank/getty images

Directions for teachers:

Before beginning the assignment, discuss international treaties with your students. International treaties are written agreements between sovereign states or international organizations that are governed by international law. Ask students to give examples of science-related international treaties and to explain why science-related international treaties are important (they can consider conservation, space, agriculture, climate change, infectious diseases, bioethics, etc.).

Next, give students access to only the graph sections “Danger Zone” and “In need of protection” from the Science News article “Migratory fish species are in drastic decline, a new UN report details.” Have students use the graphs for the first two sets of questions. Then ask them to read the rest of the article’s text to answer the questions in the third section.  

Directions for students:

Using only the graphs “Danger zone” and “In need of protection” from the Science News article “Migratory fish species are in drastic decline, a new UN report details,” answer the first two sets of questions below as directed by your teacher. Read the article before answering the questions in the third section.

Dig into the danger zone

1. What type of graph is this? What do the bars represent? What is measured on the axes (include units when necessary)?

This is a bar graph, in which each bar represents a different group of migratory animals covered by the Convention on the Conservation of Migratory Species of Wild Animals (CMS). Within each bar, conservation status is shown as the percentages of species that fall into specific categories, such as critically endangered, endangered, vulnerable, etc.  

2. Use the graph to compare the conservation status of migratory fish to birds. Which group is more threatened?

The majority of migratory bird species covered by the CMS, about 75%, are of least concern. It appears that about 2% of bird species are critically endangered, 3% are endangered, 10% are vulnerable and 10% are near threatened. The majority of migratory fish species covered by the CMS are of concern. About 1% are extinct, 49% are critically engendered, 30% are endangered, 19% are vulnerable and 1% are near threatened. Of the species covered by the CMS for each group, it appears that fish are of great concern and birds are not.

3. How are the bars for animal groups lined up on the graph? Why is the “Fish” bar on the far left and “Insects” bar on the far right?

It looks like the bars are ordered by overall group conservation status. Migratory fish covered by the CMS are most endangered and insects are of least concern, in terms of conservation status.

4. As shown on the graph, how does the percentage of critically endangered reptile species compare with the percentage of critically endangered fish species? What information is missing from the graph that could tell you more about the overall conservation status of different groups of species?

According to the graph, critically endangered reptile species account for about 28% of the reptile species covered by the CMS. Critically endangered fish species represent about 49% of the fish species covered. You cannot tell the number of species in each category on the graph. It’s possible that one group could look less vulnerable than another but have a greater number of endangered species. For example, there could have been 100 fish species included in the CMS, so about 49 of those included would be considered critically endangered. There could have been 500 reptile species included in the CMS, so about 140 of those included would be considered critically endangered. Since the graph does not indicate the total number of different species covered by the CMS, it can be difficult to compare overall conservation status of the different groups.

5. What does the graph tell you about the migratory insects included in the treaty? Read the text above the graph and explain why the bar for insects may be misleading.

The graph indicates that 100% of insect species in the CMS are of least concern. However, as the text above the graph indicated, only one type of migratory insect, the monarch butterfly, is included in the CMS. The note says that monarch butterflies are a species of least concern but that migratory monarchs are considered endangered. The portion of the species that is endangered is not reflected on the graph. 

In need of protection

1. Read the text above the graph and explain the type of graph and what is shown in the graph.

Of the species not covered by the CMS treaty (about 3,339 total species), the 399 species that are considered threatened or near threatened are separated by animal groups and are shown on a bar graph.

2. How are the axes on this graph different than those on the first graph?

The categories or groups of animals are not all the same on both graphs. Some are very specific on the second graph, such as horseshoe crabs. Also, the second graph presents the data as the number of species within a group having a specific conservation status, while the first graph shows a percentage of the species that fall within an animal group.

3. About how many fish and bird species not covered by the CMS treaty are vulnerable or endangered?

About 225 fish species and 160 bird species that aren’t covered by the CMS treaty are vulnerable or endangered. 

4. If the information from this graph were included in the previous graph, what would you guess would be the most significant change on the graph?

The first graph indicates that most of the bird species included in the CMS are of least concern. The second graph indicates that there are about 160 additional bird species (not covered by the CMS) that are of concern. In the first bar graph, the percentages of critically endangered, endangered, and vulnerable birds would increase. We can’t predict by how much though, because we don’t know from the first bar graph how many bird species are included in the CMS.

Synthesizing graphs

1. About how many migratory species are known, according to the two graphs? Explain.

The international treaty covers “more than” 1,000 migratory species, as indicated by the first graph. The text above the second graph says that the CMS covers about one quarter of all migratory animals and does not include 3,339 migratory species. So, there are more than 4,339 migratory species.

2. From your exploration of the graphs, write a brief summary of the data presented in the report. Then read the article and compare your summary to the Science News writer’s. What information wasn’t included in the graphs?

Student summaries will vary. The article gives more information about the international treaty, such as that more than 100 parties have signed and ratified the CMS since 1979, and that the U.S. is not one of those countries. The article also includes recommendations from the report on how to protect endangered migratory species, such as attaching LED lights to fishing nets so that certain fish species avoid the nets.

3. What additional information or questions do you have about the data, report or international treaty?

Student answers will vary.

4. What do you think should be the next step? How could this international treaty and report help impact the conservation status of migratory animals at risk? What are some limitations as to what it can accomplish?

Student answers about next steps will vary. The international treaty and report help to draw attention to the many species of fish that countries may not have realized were endangered. But the treaty is limited in what it can accomplish because there are no real legal penalties for not following the treaty, even if a nation has ratified it.