Skip to content
Menu
Science News Learning
Incorporate STEM journalism in your classroom
Lesson plans
All guides
Search lesson plans
• Data Analysis
• Diversity in STEM
• Literacy Practices
• Research & Design
• Graph of the Week
Program info
Sign up
About
Testimonials
Community
Webinars
Journalism
Science News
Science News Explores
• Explainers
• Scientists Say
• Analyze This
• Technically Fiction
• Cool Jobs
• STEM Comics
Donate
SIGN IN
Science News Learning
Incorporate STEM journalism in your classroom
SIGN IN
Search
Open search
Close search
Incorporate STEM journalism in your classroom
Exercise type:
Activity
Topic:
Life
Fungal Solutions
Download Student Worksheet
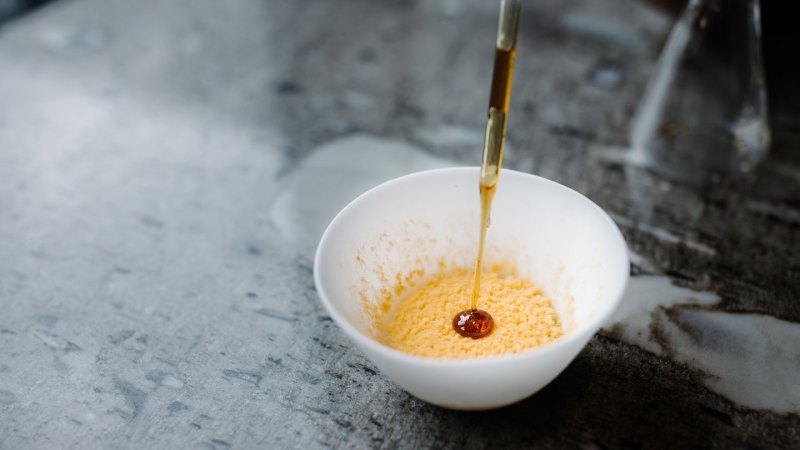
The fungus
Neurospora intermedia
(orange-colored powder) transformed a bland rice custard into a fruity treat, served at a top restaurant in Copenhagen.