LONG BEACH, Calif. — Two new videos reveal the dynamic nature of the supernova remnant Cassiopeia A — the remains of a star believed to have exploded 330 years ago. Researchers unveiled the videos on January 6 at the winter meeting of the American Astronomical Society.
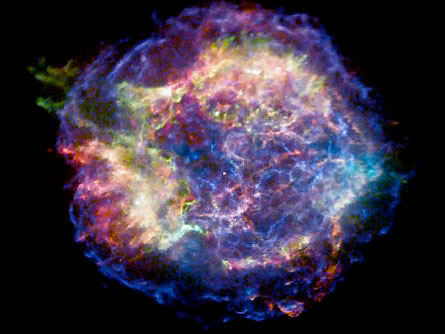
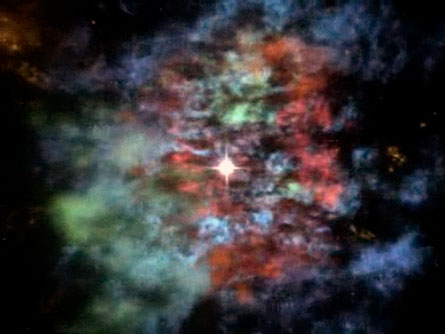
One of the videos, shown from the viewpoint of Earth, charts the evolution of the remnant over eight years using observations by NASA’s Chandra X-ray Observatory taken between January 2000 and December 2007. Daniel Patnaude of the Harvard-Smithsonian Center for Astrophysics in Cambridge, Mass., and his colleagues used the movie to determine that the leading edge of the explosion’s outer blast wave is racing outward at 18 million kilometers per hour. That’s in fact considerably slower than expected for an explosion believed to have unleashed Cassiopeia A’s estimated energy.
The other animation, which borrows techniques used in medical imaging, combines data from Chandra, NASA’s infrared Spitzer Space Telescope and ground-based, visible-light telescopes to create the first three-dimensional animation of a supernova remnant. To fully map the debris from the explosion, Tracey DeLaney of MIT and her colleagues used data that included iron-rich ejecta from the explosion seen only in X-rays, unshocked ejecta observed only in infrared emissions and the outer parts of the debris field viewed only in visible light.
The infrared data revealed that the explosion was far less chaotic than originally thought, with the outer layers of the star retaining their original order, DeLaney says.