Satellites make mapping hot spots of ammonia pollution easier

Animal feedlots and other sources of the gas can lower air quality

animal feedlots

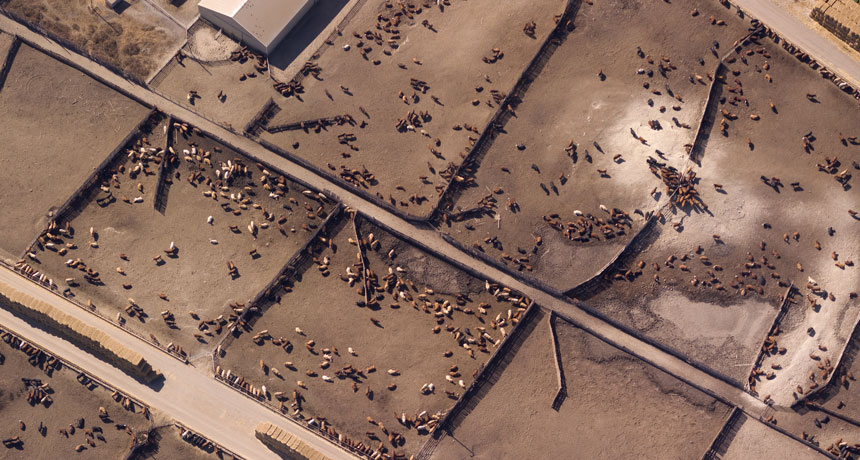
WHAT’S THAT SMELL  Feedlots hold a lot of animals — and that means a lot of urine, which releases ammonia into the atmosphere. A new satellite technique can pinpoint feedlots and other major sources of ammonia emissions.

Peakguy/iStock.com

Satellites may be a more accurate way to track smog-producing ammonia.

It’s notoriously tricky to pinpoint accurate numbers for ammonia gas emissions from sources such as animal feedlots and fertilizer plants. But new maps, generated from infrared radiation measurements gathered by satellites, reveal global ammonia hot spots in greater detail than before. The new data suggest that previous estimates underestimate the magnitude of these emissions, researchers report December 5 in Nature.

In the atmosphere, ammonia, which contains nitrogen, can help form tiny particles that worsen air quality and harm human health. The research could help keep tabs on who’s emitting how much, to make sure that factories and farms are meeting environmental standards.

Emissions are usually estimated by adding up output from individual known sources of activity, but those calculations are only as good as the data that go into them. Ammonia sticks around only hours to a few days in the atmosphere, so on-the-ground measurements vary a lot even in the same place, says coauthor Martin Van Damme, an atmospheric scientist at the Université Libre de Bruxelles in Belgium.

“There’s so much uncertainty in ammonia emissions,” says Daven Henze, a mechanical engineer at the University of Colorado Boulder who wasn’t part of the research. Other scientists, including his research group, have estimated ammonia releases using satellite data before. But these new maps rely on a more detailed dataset and have substantially better resolution, Henze says — fine enough that the study authors were able to link areas of high emissions to specific factories or farms.

The new maps show 248 nitrogen emission hot spots across the globe at a resolution of about a kilometer. Eighty-three of those hot spots arose from agricultural activity that involved high numbers of cows, pigs and chickens, such as a site in Colorado that overlapped on satellite imagery maps with two big cattle feedlots. Ammonia emissions from feedlots come largely from livestock waste. Another 158 sites were affected by industrial emissions — mostly from sites that produced ammonia-based fertilizer, such as in Marvdasht, Iran. Six hot spots couldn’t be pinned to specific activity.

Ammonia is also emitted naturally, from volcanoes or seabird colonies. But most of those sources were too weak or not concentrated enough to show up as hot spots in the data. Lake Natron in Tanzania is the one exception — its mud flats show up as an ammonia-releasing hot spot, perhaps due to decaying algae. But it’s not clear why other lakes with similar mud flats didn’t. Some natural sources may have gone undetected because of where they were located — in places with heavy cloud cover that obscured the data, or where turbulent air dissipated ammonia especially quickly, Van Damme suggests.

Some areas with particularly high overall ammonia emissions from biomass burning or fertilizer, such as West Africa and the Indus Valley in Pakistan and northern India, didn’t reveal specific hot spots, either, the researchers report.

More Stories from Science News on Environment

From the Nature Index

Paid Content