Beware the Long Tail
Economic models of risk don’t add up, cadre of researchers caution
- More than 2 years ago
When H. Eugene Stanley heard that Lehman Brothers had filed for bankruptcy, a small part of him was thrilled.
Of course, the news was distressing. The firm’s seismic collapse had disastrous consequences, not only for the global economy but also for Stanley’s daughter-in-law, who became instantly unemployed. But Lehman’s downfall was exactly the kind of rare event that Stanley, a physicist at Boston University, had been expecting.
“Many economists will tell you that the chances of something really big and bad happening are really, really small,” Stanley says. But when viewed through a different lens, he contends, catastrophic events — such as Lehman filing for bankruptcy in 2008 — aren’t exceptional but inevitable.
At the time of Lehman’s collapse, Stanley had been exploring the notion that extreme economic events, the bubbles and crashes of financial markets, might be described by a mathematical law — a tidy law, like acceleration due to gravity. And he isn’t the only outsider who has had an eye on the markets. Scientists from a range of fields have been poring over financial data, finding some curious patterns in the process.
These patterns suggest that standard economic models based on the notion of equilibrium — markets will fluctuate but then settle down like the surface of a still pond — may not capture the whole story. Freak events may be a normal part of long-term economic behavior. If that’s true, then the mathematical methods guiding Wall Street’s estimation of risk are seriously flawed, offering a dangerous false sense of security.
“You have to understand that the bad events can be really, really bad,” says J. Doyne Farmer, who is trained in physics and does research spanning several disciplines at the Santa Fe Institute in New Mexico. “And there’s a significant chance that over a five-year period we will get hit by a really big event. That’s where the rubber really hits the road.”
Gaussian-colored glasses
Discounting extreme events as improbable is a long-held tradition in economics, notes Stanley. Many mathematical models assume that financial data, such as changes in the price of a stock, fit what is known as a Gaussian, or normal, distribution — the good old bell curve. Most data cluster around an average. Move to either side of the average, and the data points become increasingly scarce, tapering off in a predictable way. A blizzard in July or the Dow Jones dropping 20 percent in one day are considered so rare that they might as well be impossible.
The Gaussian bell’s roots in finance go back to work by French mathematician Louis Bachelier, who modeled changes in share prices in the early 1900s. Bachelier recognized that some of his model’s assumptions were flawed, including the premise that the probability of extreme events is vanishingly small (he reportedly called such events “contaminators”). Yet these assumptions were preserved in later models, including the Black-Scholes formula, which underlies much of Wall Street’s estimation of risk.
In some respects, the long reign of this Gaussian approach isn’t that surprising. Many things measured in the real world fit the Gaussian mold, says Mark Newman of the Center for the Study of Complex Systems at the University of Michigan in Ann Arbor. Take the height of adult American males: It generally hovers around 6 feet, or about 180 centimeters. Plot the number of men with heights lower and higher, and the data points on either side taper off quickly. “You don’t get a mile-high human,” Newman says.
With truly Gaussian distributions, measurements that appear extraordinary, such as a person a mile tall, are probably flukes; perhaps the measurer didn’t know how to use a ruler or made a mistake in writing down the number. Termed “outliers,” these data points are often thrown out of the analysis.
But when it comes to financial data, a growing body of research suggests that outliers can be more like babies than bathwater. Such events may still be very rare; Stanley says that the probability that stocks would crash as they did on Black Monday in 1987 was “as close as you can come to never.” Yet Black Monday still happened. And while much of finance does behave within the bounds of a normal distribution, ignoring the rare, large events doesn’t capture reality.
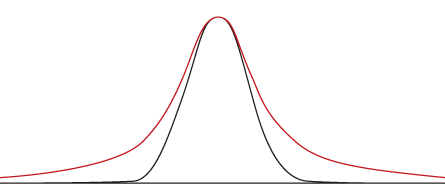
When rare extremes are included in the picture — if there really are a handful of mile-tall men — then one of the bell curve’s sloping sides doesn’t come tidily to a close. It splays out in what’s known as a long (or fat or heavy) tail. Researchers analyzing financial data are finding these tails over and over and over again.
In the 1990s — when Stanley coined the term “econophysics” to describe such research — two of Stanley’s graduate students spotted a signature long tail in U.S. market data. The team analyzed every transaction for 1,000 stocks in the major markets, looking at how much the prices of those stocks changed and how often. The more than 200 million data points included a handful of extremes, causing the graph to splay outward.
Instead of dismissing such tails because they don’t fit the models, researchers might need to rework the models because they don’t fit the data, Stanley and others argue. “The model should really be driven by the data,” he says. “For a physicist, there are no outliers. If I saw a glass of water float up in the air, we’d have to re-examine the law of gravity.”
The late mathematician Benoît Mandelbrot, father of fractals, made a similar observation in the 1960s after examining variation in cotton prices. He later called the Gaussian distribution “a model child,” one “which is commonly called ‘normal,’ but in fact deserves less and less to be considered as such.”
Power up
Long tails are a mathematical clue that a different kind of behavior may be at play, one that physicists have long been fascinated by. When data follow what is called a power law distribution, the outlandish data points that generate the tail aren’t aberrant freaks; they fit right in.
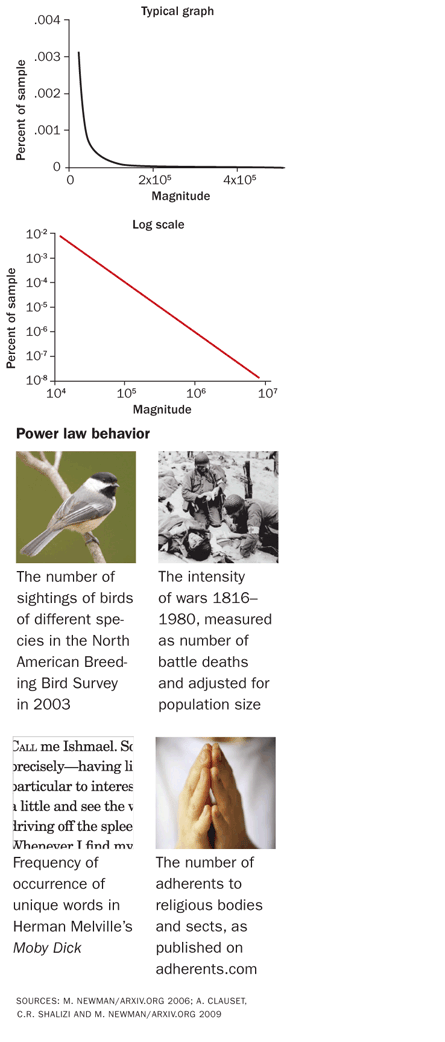
A commonly cited power law, often referred to as Zipf’s law, represents populations of towns and cities. While the majority of places people live are fair- to-middling-sized, a handful, such as New York City, have populations that are crazy large, so large that they are hard to fit with all the other towns and cities on a typical graph. To better visualize such distributions, researchers can analyze their data logarithmically — a mathematical sleight of hand that compresses the distance between the numbers. When a power law is at play, the plotted logarithms of the data don’t skew awkwardly but fall on an elegant straight line.
A classic case of the power law in economics (although it has recently been disputed) is the distribution of wealth, described by Italian Vilfredo Pareto in 1896. The wealth of the richest people is orders of magnitude greater than that of the ordinary. Forbes put Bill Gates’ net worth as of September at $59 billion; try fitting that on a traditional chart with everybody else’s.
A new analysis of transactions on the S&P 500 share index and the German DAX Future stock market also uncovered power laws at work. As prices start to rise or fall, larger and larger chunks of stock are sold with greater and greater frequency, Stanley, Tobias Preis of Boston University and Artemis Capital Asset Management, and Johannes Schneider of Johannes Gutenberg University Mainz in Germany reported in May in the Proceedings of the National Academy of Sciences. The trade volume and the time between successive trades both exhibit power law behavior.
The researchers also observed a peculiar trait of power laws: They are “scale-free.” Say, for example, that computer files 2 kilobytes in size are one-fourth as common as files of 1 kilobyte. Under a power law regime, file sizes of 2 megabytes would be one-fourth as common as those of 1 megabyte, and so on. Like Mandelbrot’s fractal geometry of a coastline or cauliflower whorl, whether you view from afar or zoom in with a microscope, the proportions remain the same.
These data suggest to Stanley that global financial crashes and the bubbles that precede them aren’t outliers. The same mechanisms that cause the smaller blips occurring in markets daily may also be generating bigger crashes.
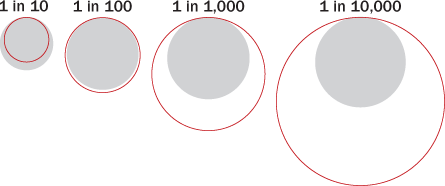
Knowing that such extreme events will happen doesn’t mean researchers can predict when, Stanley says. But acknowledging power law behavior may help investors and regulators pin the right number on risk. Having a power law distribution changes how often you’d expect to see an event sitting far from the data’s average, a distance measured in “standard deviations.” With a Gaussian model, an event that’s 100 standard deviations out — so far out it’s considered impossible — has a probability of about 1 in 10350. With a power law distribution, that likelihood shoots up to 1 in 108, Stanley notes.
Farmer, who made a small fortune working in the financial sector throughout the 1990s, says knowing how often big events may hit is crucial for estimating risk: “You have to understand your tail.”
Recent work by Farmer, Stefan Thurner of the Medical University of Vienna and Yale economist John Geanakoplos suggests that some investment strategies can actually create a power law long tail. Say you see an underpriced stock. You buy it, which normally would push the price up a bit. But if you’re using leverage (borrowed money) to try to amplify your returns, and then the bank cuts you off, you might be forced to sell prematurely or sell off other assets. This selling can push prices down and then other outfits may sell too, because they see the price sliding.
“Heavy-tailed events can be caused by leverage,” Farmer says. “It can create a crash.” His team’s simulations suggest that adding leverage to a market tips the distribution of price changes from a Gaussian to a power law distribution. And when banks cut off many borrowers to control risk, the situation can get worse, the team reported in 2009 in a Santa Fe Institute working paper.
Power laws in one area of the economy may lead to others, says economist Xavier Gabaix of New York University’s Stern School of Business. The power law distribution of CEO pay may arise from the interplay between a phenomenon known as the economics of superstars and a power law that exists for firm size, he and colleague Augustin Landier, who is now at the Toulouse School of Economics in France, reported in 2008 in the Quarterly Journal of Economics. Even though there are only slight differences in talent within the cream of the crop, firms want the best CEO. Competition among large firms for really good CEOs can lead to huge differences in income, especially when some firms are supersized, the researchers contend.
Another consequence of firm size’s power law is that major events, such as an employee strike or the invention of the smartphone, don’t dissipate gently through the market. When superlarge firms, such as Nokia, have huge successes or failures, these events can steamroll their way across an entire economy. In fact, such idiosyncratic shocks to the 100 largest U.S. firms may account for about one-third of the volatility seen in the whole market, Gabaix reported in May in Econometrica.
An eye on outliers
Some researchers argue that understanding the whole economic picture will mean incorporating more than just power laws. Occasionally crashes are so large that they are outliers even from the power law distribution, says Didier Sornette of ETH Zurich. Their specialness makes them predictable, says Sornette, who calls the standout events “dragon-kings.”
“Dragons are not like the ordinary animals you meet in the zoo,” Sornette says. “They require new mechanisms, new biology to explain them.” The “kings” part of the name refers to the fortunes of royal families, which after centuries of concentrating wealth have so much that they no longer even fit in Pareto’s distribution of wealth.
“We believe that there are events that are in a class of their own,” Sornette says. “While the power law distribution is a good characterization of the distribution of returns, it actually misses the elephant in the room, the dragon-king.”
Sornette and his colleagues argue that understanding dragon-kings may help economists spot markets teetering toward crashes. Out-of-control growth can be one sign of an approaching dragon-king. When herding behavior among investors amps up, a stock’s or index’s growth rate can increase faster than exponentially, leading to more herding, Sornette says. This positive feedback among investors, the same sort of feedback that concentrates the wealth of kings, brings the system to a tipping point. About two-thirds of the time, a crash results, Sornette wrote in a 2009 paper online at arXiv.org.
Working out of the Financial Crisis Observatory at ETH Zurich, Sornette and his colleagues are now trying to use this aggressive growth as a signature to identify crashes before they happen (often encrypting the data so as not to influence the markets).
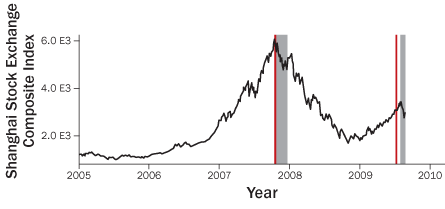
The researchers seem to be on to something. While other market watchers remained enthusiastic about the outlandish growth of the Shanghai Stock Exchange Composite Index into the summer of 2009, Sornette and his colleagues announced on July 10 that a downturn was coming. They predicted that the bubble burst would begin between July 17 and 27. It popped on July 29.
Though great strides are being made in understanding outliers, how to reconcile the newfound importance of seemingly freak events with traditional models based on stability and equilibrium isn’t yet clear.
Many economists agree that current models grossly oversimplify things: “Almost no economists think that the Gaussian is a very good approximation of reality,” Gabaix says.
But power law math is much messier than Gaussian math. Even figuring out where a power law distribution begins can be tough. Pareto’s classic case of income probably follows a power law only in its tail, for example, with the wealth of the majority of the population based on labor for pay.
To keep things simple, models leave out a lot, Gabaix says. The key, and a very difficult thing, is making sure that the most important ingredients are included. “Power laws,” he says, “are one of those intriguing facts that force people to write new theories that hopefully will explain them.”
A DIFFERENT DISTRIBUTION
When displayed on a typical graph, data that follow a power law distribution form a long tail (below, top graph). But graph the same data on a log scale and they fall onto a straight line (bottom graph). By applying several statistical tests, a recent analysis identified data sets that probably show power law behavior (bottom).
 bird: KenCanning/ISTOCKPHOTO; war: archives.gov/Still Picture Branch (NNSP); hands: bradleym/ISTOCKPHOTO