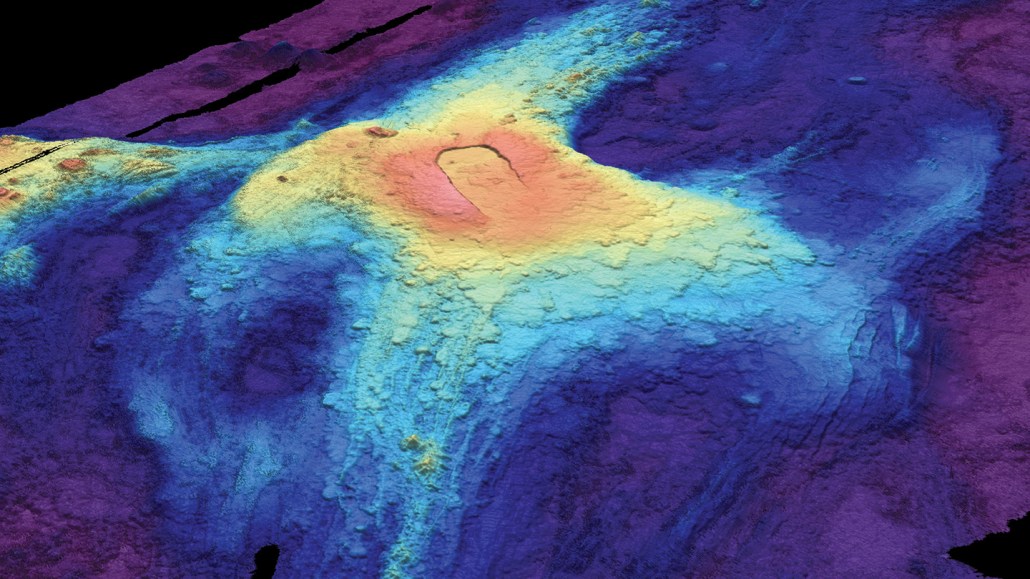
A 3-D bathymetric (seafloor) map of Axial Seamount in July 2014 shows lava flows from previous eruptions. Red indicates lava at the highest elevation above the seafloor, while dark blue at the edges shows where lava flow was thinnest.
Susan Merle/Oregon State University