Maps show genetic diversity in mammals, amphibians around the world
Charts provide a baseline to study humans’ effects on species
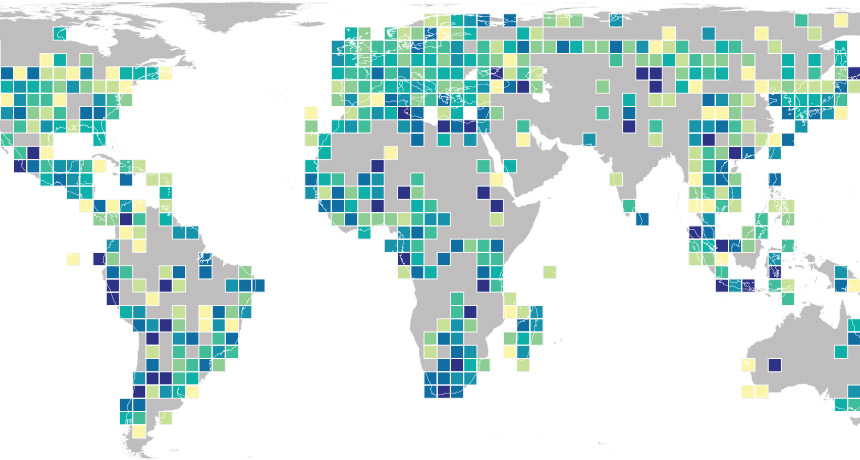
A DIFFERENT WAY TO MAP BIODIVERSITY Maps of genetic diversity within mammal and amphibian species provide a baseline for understanding the effects of human activity and climate change on animals.
Michael K. Borregaard, A. Miraldo et al/Science 2016
Maps have long been used to show the animal kingdom’s range, regional mix, populations at risk and more. Now a new set of maps reveals the global distribution of genetic diversity.
“Without genetic diversity, species can’t evolve into new species,” says Andreia Miraldo, a population geneticist at the Natural History Museum of Denmark in Copenhagen. “It also plays a fundamental role in allowing species populations to adapt to changes in their environment.”
Miraldo and her colleagues gathered geographical coordinates for more than 92,000 records of mitochondrial DNA from 4,675 species of land mammals and amphibians. The researchers compared changes in cytochrome b, a gene often used to measure genetic diversity within a species, and then mapped the average genetic diversity for all species within roughly 150,000 square-kilometer areas.
Story continues after slideshow
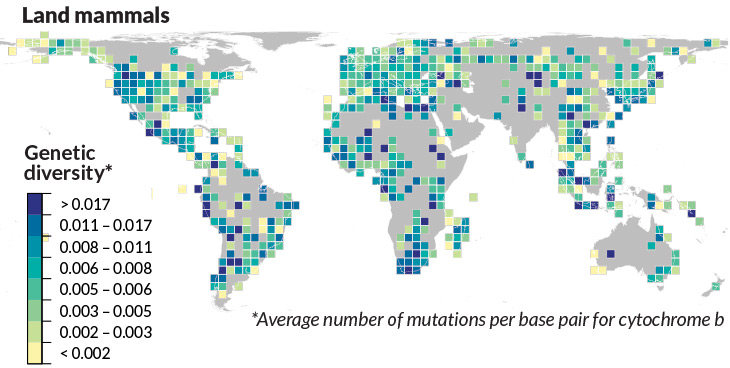
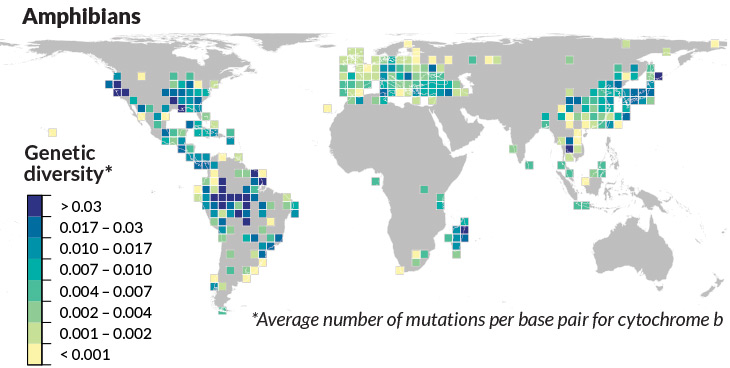
For both mammals and amphibians, the tropical Andes and the Amazon have high genetic diversity, shown in dark blue. The same is true for mammal species in subtropical regions of South Africa and amphibian species in eastern North America, Miraldo and colleagues report in the Sept. 30 Science.
Areas affected by people, such as cities and croplands, show lower genetic diversity. The maps are a snapshot and so can’t quantify humans’ impact on this key marker, Miraldo notes. But she hopes the work provides a baseline to monitor how human activity and changes in climate affect the distribution of genetic diversity around the globe.