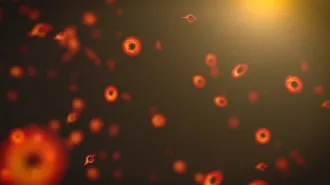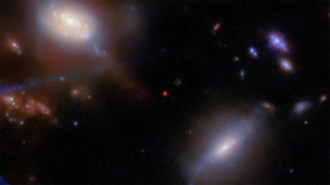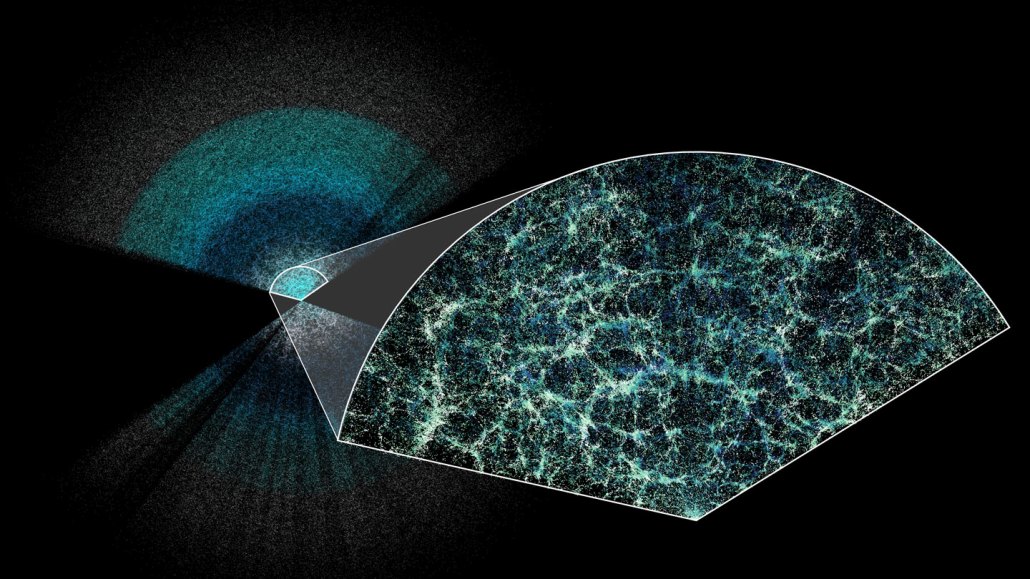
The largest 3-D map of the universe (a thin slice shown, inset), made with data from the Dark Energy Spectroscopic Instrument, contains clues that suggest dark energy’s behavior changes over time.
Claire Lamman/DESI collaboration; custom colormap package by cmastro
A massive survey of the cosmos is revealing new details of one of the most mysterious facets of the universe, dark energy. Intriguingly, when combined with other observations, the data hint that dark energy, commonly thought to maintain a constant density over time, might evolve along with the cosmos.
The result is “an adrenaline shot to the cosmology community,” says physicist Daniel Scolnic of Duke University, who was not involved with the new study.
Dark energy, an invisible enigma that causes the universe’s expansion to speed up over time, is poorly understood, despite making up the bulk of the universe’s contents. To explore that puzzle, the Dark Energy Spectroscopic Instrument, DESI, has produced the largest 3-D map of the universe to date, researchers report April 4 in 10 papers posted on the DESI website, and in talks at a meeting of the American Physical Society held in Sacramento, Calif. By analyzing patterns in the distributions of galaxies and other objects on that map, scientists can determine the history of how the universe expanded over time.
Although consistent with the cosmologists’ standard picture of the universe, the data also allow for the possibility that dark energy’s equation of state, which describes how the pressure of dark energy relates to its density, might vary over time. That would mean an upheaval in the way scientists understand the universe’s history.
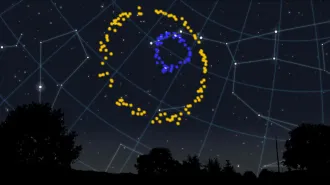
The study analyzes the project’s first year of data, mapping out the locations of 6.4 million galaxies and quasars — the ultrabright cores of violently active galaxies. This map allows scientists to estimate the rate of expansion of the universe, thanks to a handy size reference present in the universe. Sound waves in the early universe set up patterns in the density of matter in the universe, known as baryon acoustic oscillations. As galaxies form, those density variations persist, with the result that galaxies are more likely to be separated from one another by a preferred distance (SN: 3/4/19). That distance acts like a ruler, which is stretched by the expansion of the universe. Measuring the size of that ruler over various eras of the cosmos can show how the universe expanded.
The scientists divided the universe into seven epochs, stretching back in time as far as 11 billion years and measured its expansion over time. The more recent time slices corresponded to different types of galaxies. Looking back further in the universe’s history, the light from galaxies becomes too faint. So scientists turned to distant quasars and to measurements of how hydrogen gas absorbs the quasars’ light.
DESI scientists then compared their data to the standard cosmological theory, known as lambda CDM, in which dark energy’s density is assumed to be constant over time. The data matched that lambda CDM picture well. But the researchers didn’t stop there. They considered a theory in which dark energy’s behavior, namely its equation of state, is allowed to vary over time.
On its own, the DESI data couldn’t precisely determine how dark energy evolved. So the team combined their data with studies of supernovas, exploding stars, to improve the estimate. That combined data fit better to an evolving dark energy than to one that was unchanging. Depending on the set of supernova data the researchers used, the significance of that effect was more than 3 sigma. (In physics, 5 sigma is considered the gold standard for discovery; 3 sigma is considered an intriguing hint.) “It’s definitely not discovery level, but it’s definitely like, this is exciting,” Scolnic says. “It’s not nearly as ‘vanilla’ as I think people might have been expecting.”
More data may help clarify the situation. “We have a lot more data to come that will really tell us if the hints we’re seeing are confirmed,” says DESI physicist Nathalie Palanque-Delabrouille of Lawrence Berkeley National Laboratory in California. DESI scientists will collect five years of data, eventually cataloging 3 million quasars and 37 million galaxies.
These initial results demonstrate that DESI scientists are on their way. With more data, says astrophysicist Michael Wood-Vasey of the University of Pittsburgh, “they really can achieve the goals they set out, of trying to figure out what dark energy is, trying to figure out if there’s some deviation from lambda CDM.” However, at the moment, he’s unfazed by the potential hints of new physics. “I’m a little conservative so I don’t get deeply excited about hints about stuff.”
Cosmology is already beset with controversy over measurements of the Hubble constant, the current rate of the universe’s expansion (SN: 7/30/19). Different ways of measuring that number produce results that clash. DESI’s measurements don’t resolve that Hubble constant tension. But if scientists move away from their standard lambda CDM model, that could change the Hubble constant situation. That’s because the tension is based on the assumption that the lambda CDM model is correct, says DESI collaborator Dillon Brout, a physicist at Boston University. “This … would potentially blow the [Hubble] tension wide open.”