Marie Tharp’s groundbreaking maps brought the seafloor to the world
Her deep understanding of geology made for gorgeous and insightful views

Barred from ocean expeditions for most of her career, Marie Tharp poured all of her energy into mapping the seafloor — creating the most comprehensive views available.
Granger Collection
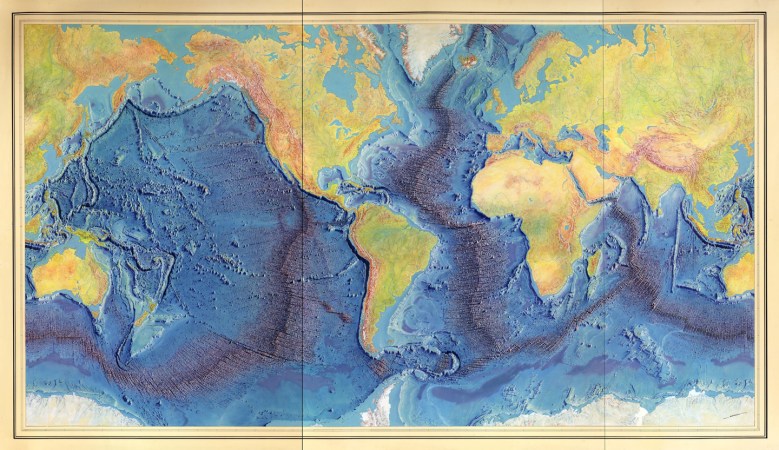
Walk the halls of an academic earth sciences department, and you’ll likely find displayed on a wall somewhere a strikingly beautiful map of the world’s ocean floors. Completed in 1977, the map represents the culmination of the unlikely, and underappreciated, career of Marie Tharp. Her three decades of work as a geologist and cartographer at Columbia University gave scientists and the public alike their first glimpse of what the seafloor looks like.
In the middle of the 20th century, when many American scientists were in revolt against continental drift — the controversial idea that the continents are not fixed in place — Tharp’s groundbreaking maps helped tilt the scientific view toward acceptance and clear a path for the emerging theory of plate tectonics.
Tharp was the right person in the right place at the right time to make the first detailed maps of the seafloor. Specifically, she was the right woman. Her gender meant certain professional avenues were essentially off-limits. But she was able to take advantage of doors cracked open by historical circumstances, becoming uniquely qualified to make significant contributions to both science and cartography. Without her, the maps may never have come to be.
“It was a once-in-a-lifetime — a once-in-the-history-of-the-world — opportunity for anyone, but especially for a woman in the 1940s,” Tharp recalled in a 1999 perspective. “The nature of the times, the state of the science, and events large and small, logical and illogical, combined to make it all happen.”
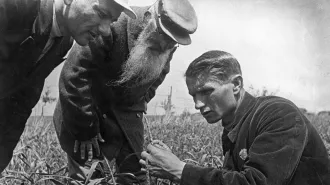
Tharp’s cartographic roots ran deep. She was born in Michigan in 1920 and as a young girl would accompany her father on field trips to survey land and make maps for the U.S. Department of Agriculture’s Bureau of Soils, a job that kept the family on the move. “By the time I finished high school I had attended nearly two dozen schools and I had seen a lot of different landscapes,” Tharp recalled. “I guess I had map-making in my blood, though I hadn’t planned to follow in my father’s footsteps.”
Tharp was a student at the Ohio University in 1941 when the attack on Pearl Harbor emptied campuses of young men, who were joining the military in droves. This sudden scarcity of male students prompted the University of Michigan’s geology department to open its doors to women. Tharp had taken a couple of geology classes and jumped at the opportunity. “There were 10 or 12 of us that appeared from all over the United States, girls. With a sense of adventure,” she recalled in an oral history interview in 1994. Tharp earned a master’s degree in 1943, completing a summer field course in geologic mapping and working as a part-time draftsperson for the U.S. Geological Survey along the way. Upon graduating she took a job with an oil company in Oklahoma but was bored by work that involved neither fieldwork nor research. So she enrolled in night classes to earn a second master’s degree in mathematics from the University of Tulsa.
To celebrate our upcoming 100th anniversary, we’re launching a series that highlights some of the biggest advances in science over the last century. For more on the story of plate tectonics, visit Century of Science: Shaking up Earth.
Looking for more excitement, she moved to New York City in 1948. When she walked into the Columbia University geology department looking for a job, her advanced degrees got her an interview, but the only position available to a woman was that of a draftsperson assisting male graduate students working toward a degree in geology that she had already earned. Still, it seemed more promising than the other job she had inquired about — studying fossils at the American Museum of Natural History — so she took it.
The following year Tharp became one of the first women employed by Columbia’s newly founded Lamont Geological Observatory and soon was working exclusively with geologist Bruce Heezen, a newly minted Ph.D. Like many of the male scientists at Lamont, Heezen was primarily occupied with collecting ocean data, which Tharp would then analyze, plot and map — work she was more than qualified to do.
“These men considered it glamorous and pleasurable to go to sea, far more so than staying at home to analyze [the data],” writes science historian Naomi Oreskes of Harvard University in her forthcoming book Science on a Mission: How Military Funding Shaped What We Do and Don’t Know About the Ocean. “This is one reason data analysis was often left to women.” In fact, women often weren’t allowed on the research ships at all.
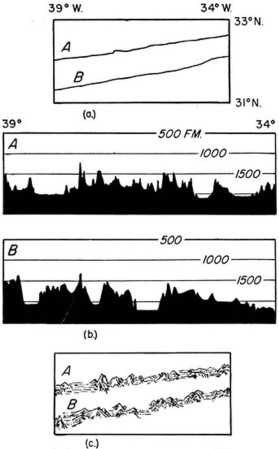
Barred from ocean expeditions, Tharp poured all of her energy into mapping the seafloor starting with the North Atlantic, work that would lead to two important discoveries. To make a map, she first translated the echo soundings gathered by ships crossing the ocean into depths and then created two-dimensional vertical slices of the terrain beneath the ships’ tracks. These ocean-floor profiles showed a broad ridge running down the middle of the Atlantic. Though the feature had been roughly mapped in the 19th century, Tharp noticed a notch near the top of the ridge in each of the profiles. She believed the notches represented a continuous, deep valley running down the center of the mid-ocean ridge. If she was right, the valley might be a rift where molten material came up from below, forming new crust and pushing the ocean floor apart — evidence that could support continental drift.
The idea that the continents were not fixed in place had gained traction in Europe, but Heezen, like most U.S. scientists at the time, “considered it to be almost a form of scientific heresy,” Tharp later wrote in Natural History magazine. It took her a year or so to convince Heezen that the rift was real, and it took the two several more years to finish their first map of the North Atlantic in 1957.
In order to publish that first map and share their work with other scientists, Tharp and Heezen had to get around the U.S. Navy’s Cold War–inspired decision to classify detailed topographic maps that used contour lines to indicate depths. This was one of the reasons the pair chose to adapt a relatively new cartographic style known as a physiographic diagram, a sort of three-dimensional sketch of terrain as if seen from an airplane window. To do this, Tharp had to use her training as a geologist and experience with mapping on land — knowledge and skills that a typical research assistant or draftsperson wouldn’t have had.
Physiographic maps had previously been used to represent continental landforms with standardized symbols. Each type of mountain, valley, plain and desert was sketched in a specific way. Tharp and Heezen were the first to use the technique to show what unknown, unseeable terrain might look like. Tharp first sketched a strip of seafloor along each profile, deciphering what type of landform each bump and dip was likely to be. Then she identified patterns to fill in the blank spaces between the profiles.
“The amount of work involved in taking it from just from those soundings and being able to create that is just amazing,” says historian Judith Tyner, author of Women in American Cartography.
As Tharp was creating her map, an unrelated project was taking shape on the drafting table next to hers. Heezen had hired a recent art school graduate to plot thousands of earthquake epicenters in the Atlantic Ocean to help Bell Labs find the safest places to lay transoceanic cables. The epicenters he was plotting lined up with Tharp’s rift valley. The correlation lent weight to the idea that the rift was where the crust was pulling apart, and gave Tharp a way to accurately locate the rift between the ship tracks.
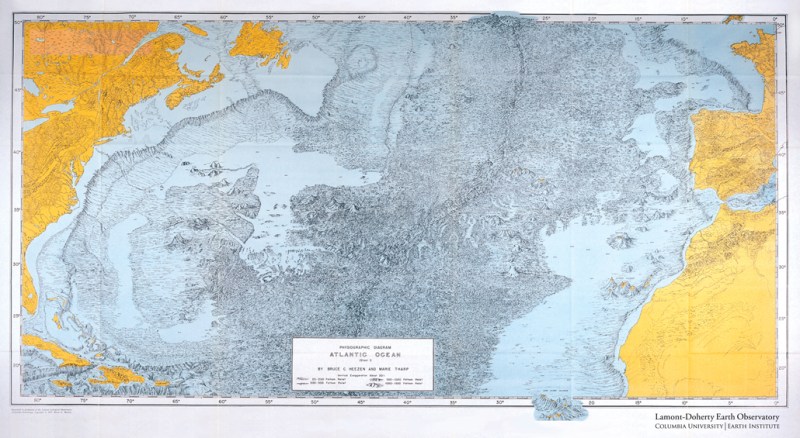
Heezen and Tharp’s 1957 diagram of the north Atlantic Ocean was by far the most exhaustive seafloor map ever produced.
“The marvelous thing about that map is how comprehensive it looked on rather limited data,” says science historian Ronald Doel of Florida State University in Tallahassee. “But the earthquake data also helped to make clear just where the ridges are oriented and where the associated geological features are.”
The American scientific community was initially skeptical, wary of the speculative nature of their map. But as the pair continued mapping the rest of the Atlantic and moved on to other oceans, evidence accumulated for a continuous ridge, with a rift valley at its center, stretching for some 60,000 kilometers across the globe.
Tharp and Heezen’s innovative use of the physiographic method gave scientists a compelling visual comparison to continental landforms they understood. This helped convince them that just as the East African Rift was splitting that continent, the submarine rift valley marked where the continents on either side of the Atlantic had pulled away from each other.
“That’s why her map is so powerful,” says historian of geology David Spanagel of Worcester Polytechnic Institute in Worcester, Mass. “It allows people to see the bottom of the ocean as if it were a piece of land, and then reason about it. That’s a transformative thing that she’s able to accomplish.”
National Geographic also took notice of the maps and invited Heezen and Tharp to collaborate on some ocean illustrations with the Austrian painter Heinrich Berann, who would become famous for his mountain panoramas. The gorgeous ocean-floor depictions were included as poster-sized supplements in issues of National Geographic magazine between 1967 and 1971. The magazine had a circulation of 6 million or 7 million at the time, giving a sizable swathe of the public a window into the ocean.
In 1973, Heezen and Tharp received a grant from the U.S. Navy to work with Berann on a complete map of the world’s ocean floors. It took the trio four years to create their iconic cartographic masterpiece, an unparalleled, panoramic visualization that continues to shape how both scientists and the public think about the seafloor.
The map was finished just weeks before Heezen died of a heart attack at age 53, while in a submarine exploring the mid-ocean ridge near Iceland. His death left Tharp without a source of funding and data, essentially ending her remarkable career. It would be decades before her contributions were fully recognized. But unlike many other unsung figures in the history of science, the accolades began rolling in before she died of cancer in 2006. During the last decade of her life, Tharp received prestigious awards from several institutions including Lamont — now known as the Lamont-Doherty Earth Observatory — and the Library of Congress, which named her one of the four greatest cartographers of the 20th century.
“Can you imagine what heights she would have risen to in her profession,” says Tyner, “if she’d been a man?”
Though hers was always the second name, after Heezen’s, on the maps they made, and doesn’t appear at all on many of the papers her work contributed to, Tharp never expressed any regrets about her path. “I thought I was lucky to have a job that was so interesting,” she recalled in 1999. “Establishing the rift valley and the mid-ocean ridge that went all the way around the world for 40,000 miles — that was something important… You can’t find anything bigger than that, at least on this planet.”
We summarize the week's scientific breakthroughs every Thursday.