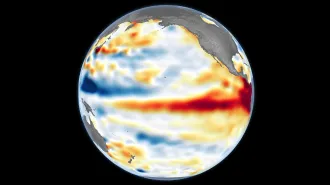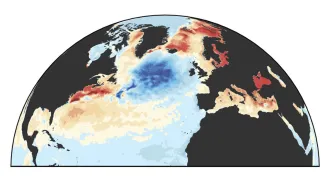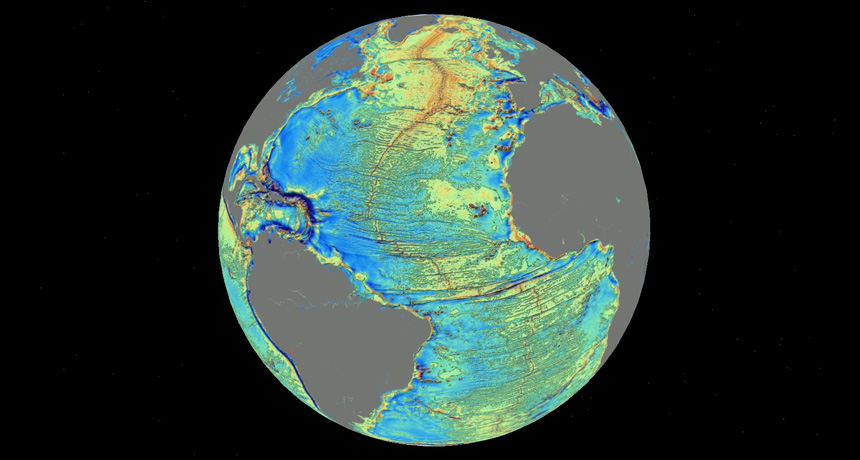
SUNKEN SURFACE A new map charts the depths of Earth’s oceans (Atlantic shown) in unprecedented detail using satellite data. Warm colors correspond to formations such as mountains and continental shelves; bluer colors represent deeper areas such as trenches.
Google Earth, overlay by D.T. Sandwell/Scripps Institution of Oceanography
A new comprehensive map of Earth’s seafloor reveals never-before-seen features hidden deep below the waves, including thousands of uncharted underwater mountains. The map, presented in the Oct. 3 Science, is the most accurate global seafloor map ever made and could provide new clues to how Earth’s surface got its shape.
“We know a lot about the continents, but we know almost nothing about what’s going on in the oceans,” says lead author David Sandwell, an earth scientist at the Scripps Institution of Oceanography in La Jolla, Calif. “It’s like being on another planet; the ocean is probably the most unexplored feature in the inner solar system.”
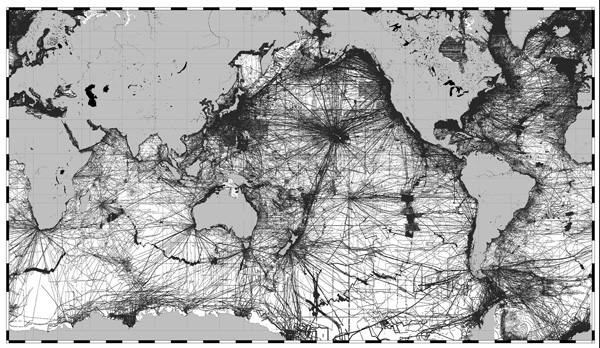
Over the last 40 years, hundreds of ships have mapped slices of the seafloor by measuring how long it takes for sound to bounce off the ocean bottom. However, roughly 80 percent of the ocean floor lacks detailed topographic measurements, including much of the Indian Ocean region where Malaysia Airlines Flight 370 disappeared earlier this year. Scientists say filling such gaps with ship-based data would require decades of work and billions of dollars.
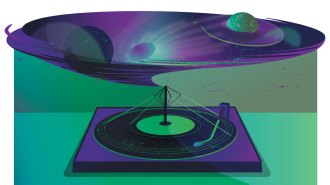
Tiny changes in sea level serve as a fingerprint of what lies below. Massive submerged mountains and ridges that jut out of the seabed pull in water with their strong gravitational pull. Because water is hard to compress, the excess water forms a tiny bump on the ocean surface that mimics the topography of the underlying seafloor.
These changes in sea level can be as subtle as a centimeter, so the team combined multiple satellite measurements to correct for temporary changes in sea level from waves and tides. With the combined data, the team discerned the existence of submerged formations measuring about 2 kilometers across or wider. The new measurements are more than twice as accurate as those Sandwell and a colleague used to create a previous map in 1997, in large part due to new satellite data and refined computer processing.
Although the new map’s accuracy still pales in comparison to ship-based measurements, which can distinguish features as small as a few meters across, both methods are important, says marine geologist Jim Gardner of the University of New Hampshire in Durham. “When I go out in a ship, I can see things they can’t possibly see using satellites,” he says, “but this new map shows us large-scale details of the seafloor and areas of the ocean that haven’t been mapped before.”
Already Sandwell’s team has identified numerous previously uncharted formations hidden beneath Earth’s oceans, including 5,000 underwater mountains taller than New Hampshire’s Mount Washington and the precise boundary where the South American and African continents ripped apart during the Pangea supercontinent’s breakup around 100 million years ago. The team also located, for the first time, the rift where the Gulf of Mexico expanded until about 150 million years ago.
Still, they’ve only scratched the surface, Sandwell says. “It’ll take years to really go through the map in detail and find all the interesting things.”
Editor’s Note: This article was updated October 28, 2014, to correct the size of the subtlest changes in sea level.