The frazzled host of an impending dinner party is trying to come up with a seating plan that would satisfy his guests.
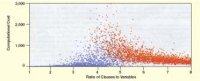
Each point on this graph shows the relative computational effort
required to solve a given satisfiability problem or show that it’s
insoluble. For so-called 3-SAT problems, researchers find a sharp
transition between problems that are solvable (blue dots) and those that
turn out to be impossible to solve (red dots) when the ratio of
constraints to variables is about 4.25
Log in
Subscribers, enter your e-mail address for full access to the Science News archives and digital editions.