Over the centuries, mathematicians have developed a variety of methods of solving equations. Using the capabilities of modern computers, they have explored in detail how these age-old recipes work–when the methods can be relied upon, when they fail, and when they behave strangely.
Such computer explorations have also yielded vivid visual representations of the underlying mathematical processes. At the same time, a few artists have taken advantage of the techniques used to visualize mathematics to create aesthetically pleasing patterns and intriguing artworks.
As one recent example of such endeavors, computer scientist Bahman Kalantari of Rutgers University has developed visualization software that brings the process of finding the roots of a polynomial equation into the realm of design and art.
A polynomial is an algebraic expression involving powers of a variable, such as x2 + x – 6 or x3 – 10x2 + x + 3. Anyone who has studied high-school mathematics is probably familiar with the problem of finding values of x for which x2 + x – 6 = 0. In this case, x can be either 2 or –3. The two solutions, 2 and –3, are known as the roots of the equation.
One way to picture what is happening is to plot a graph that shows what the quadratic equation y = x2 + x – 6 looks like. When the equation’s value, y, is computed for various values of x, the resulting pairs of numbers represent coordinates that can be plotted on a sheet of graph paper. The resulting curve is a parabola that crosses the horizontal (x) axis twice: at x = 2 and x = –3.
Mathematicians have developed algorithms for finding the roots of polynomial equations without having to plot graphs and locate where curves cross the x axis. In many instances, repeated applications of the basic steps provide better and better estimates of an equation’s roots.
The same notions can be extended to polynomial equations involving complex numbers.
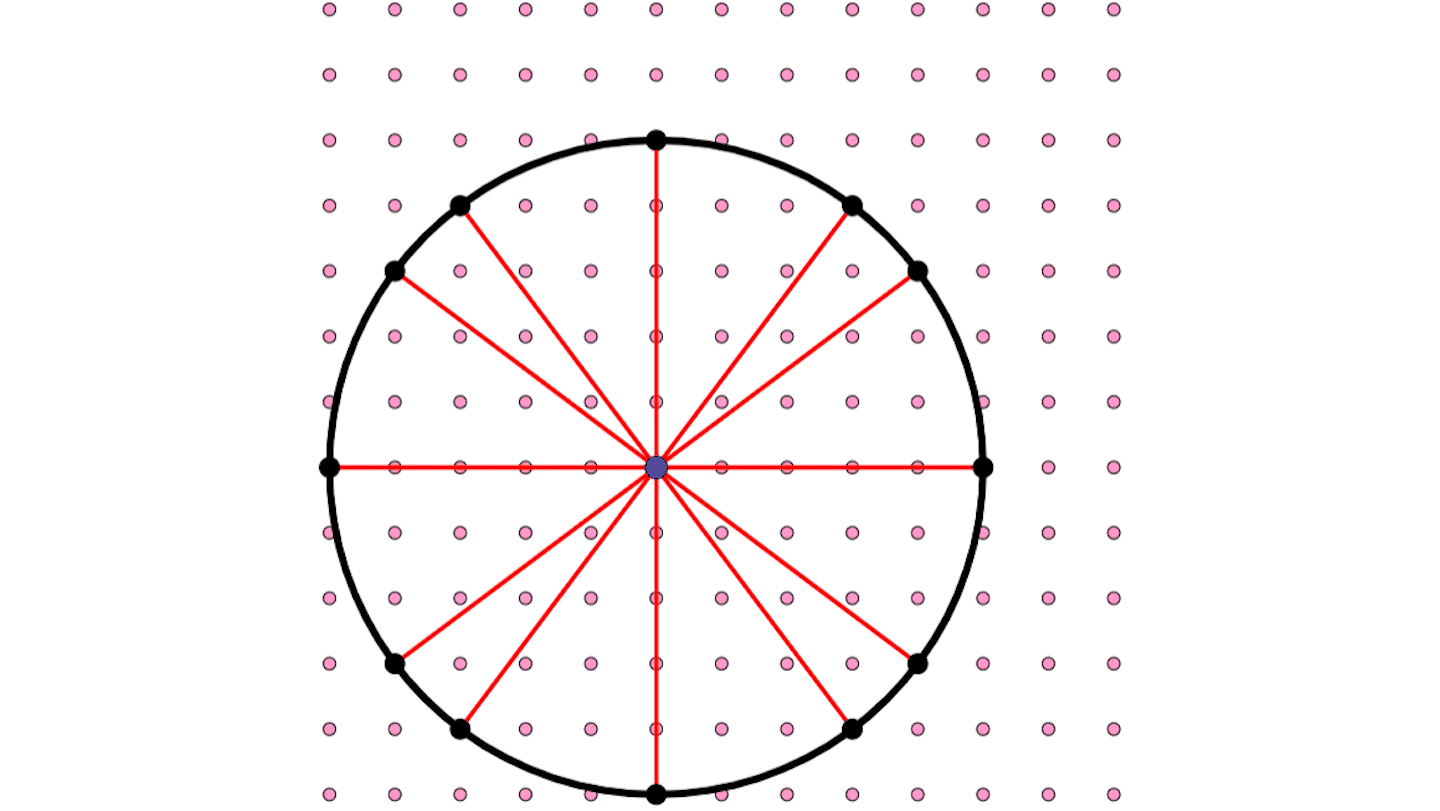
A complex number, z, has two parts and can be written as a + bi, where a is the “real” part and bi is the so-called “imaginary” part, with i representing the square root of –1. Such numbers can be plotted as points on a graph. Each complex number has a “real” x coordinate and an “imaginary” y coordinate. The complex number 3 + 4i would be plotted as the point (3, 4), for example, on what mathematicians term the complex plane.
Kalantari has turned the process of approximating the roots of polynomials involving complex numbers into a method of generating interesting designs. He calls his system polynomiography. “Polynomiographs are obtained using algorithms requiring the manipulation of thousands of pixels on a computer monitor,” he says.
A polynomial equation such as z4 – 1 = 0 has as many roots as the highest power to which z is raised in the equation (the equation’s degree). In this instance, there are four complex roots. The equation z17 – z5 + 6 = 0 has 17 solutions, or roots.
The basic idea underlying a polynomial root-finding method is to guess a starting point, use a specified algorithm to find a “better” point, then repeat the same steps with the new point, and so on, with the goal of coming closer and closer to a root of the given polynomial.
When a root-finding method is used to locate a specific root, the solver hopes that the chosen starting point leads quickly to the appropriate root. That doesn’t always happen, however.
Computer graphics provides a way to picture what is happening. For a given equation, the computer applies a specified root-finding method to a large number of values of z. For each starting value, the computer determines toward which root that value converges and assigns a color to the point–a different color for each root. Shades of the color indicate how quickly that point comes close to the root.
The result is a glowing tapestry that often features large pools of color. These basins of attraction, as they are known, are “safe” areas. Any starting point selected from a safe region, within a reasonable number of iterations, comes close to a root. The equation z4 – 1 = 0 has four such basins.
Life near or at a boundary between these basins, however, can be considerably more complicated. Much more than simple dividing lines, the borders often consist of elaborate swirls and whirlpools that can pull the given root-finding method into any one of the four roots of z4 – 1 = 0. In these vicinities, tiny shifts in starting point can lead to widely divergent destinations.
Kalantari has extended and adapted such visualization techniques to the creation of vividly colorful, aesthetically pleasing patterns, particularly in exploring the relatively unknown territory of polynomials of degree higher than 10 or 20. In doing so, he relied on a fundamental family of iteration functions (which he called the “Basic Family”) for approximating all roots of polynomials.
Kalantari’s visualization software allows the user to specify a polynomial, select the iteration method and color scheme, and then manipulate the colors and scale of the resulting image.
“The ‘polynomiographer’ can create an infinite variety of designs,” Kalantari says. “This is made possible by employing an infinite variety of iteration functions . . . to the infinite class of complex polynomials.” Then it’s a matter of playing with the scale, isolating parts of an image, adjusting colors, and so on to get a pleasing result.
“Working with polynomiography software is comparable to working with a camera or a musical instrument,” Kalantari contends. “Through practice, one can learn to produce the most exquisite and complex patterns. These designs, at their best, are analogous to the most sophisticated human designs.”
Kalantari’s Web site devoted to the visualization of polynomials can be found at http://www.polynomiography.com/, where you can try creating your own patterns.