How next-gen computer generated maps detect partisan gerrymandering

Researchers are ready to expose hidden biases when redistricting begins in 2021

gerrymandering protesters

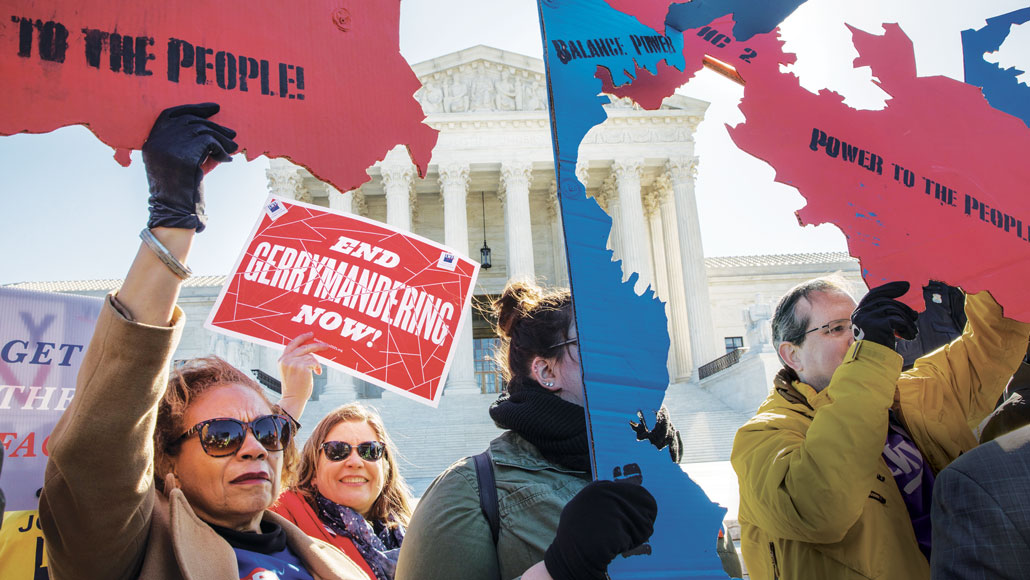
In March 2019, the U.S. Supreme Court heard expert testimony on how to test for partisan skew in the way district maps are drawn. Protesters (shown) demanded an end to gerrymandering.

Evelyn Hockstein/The Washington Post/Getty Images

In October 2019, a state court determined that North Carolina’s congressional districts had been severely gerrymandered and struck down the state’s map. The court’s ruling was informed, in part, by tens of thousands of alternative maps demonstrating that the district boundaries had very likely been manipulated for political gain, the very definition of gerrymandering.

Researchers had generated a slew of alternative, computer-generated maps designed to help identify potential patterns of bias. The approach is increasingly used, alongside other tests, to ferret out alleged gerrymandering. District manipulations can be so subtle that they’re undetectable just by looking at them. “The eyeball test is no good,” says Jonathan Katz, a political scientist and statistician at Caltech.

U.S. states redraw their district lines every 10 years to adjust for changing demographics picked up by the national census. The last round a decade ago raised eyebrows, most notably for districts drawn in Michigan, North Carolina and Pennsylvania.

“The post-2010 round of redistricting is widely viewed as a time of extreme, even egregious, partisan gerrymandering,” retired political scientist Richard Engstrom wrote in the January 2020 Social Science Quarterly.

A 2017 report by the nonpartisan Brennan Center for Justice at New York University School of Law noted that existing congressional maps were largely biased in favor of the Republican Party. In 26 states, which account for 85 percent of U.S. congressional districts, as many as 17 Republicans in the House of Representatives owe their seats to gerrymandering. In states where Democrats controlled the redistricting process, partisan bias is also a problem, but the effect is smaller because those states are often made up of fewer districts.

Since 2011, legal scholars, political scientists and mathematicians conducting gerrymandering research have served as expert witnesses in more than 250 state and federal court cases regarding redistricting.

With the 2020 U.S. census now under way, legislators will soon be revising electoral districts again. This time around, researchers hope that instead of serving as expert witnesses in court, they can help identify problematic districting before the new maps even go into effect.

“In 2010, the politicians were thinking very hard on how to draw maps,” while the public and academics weren’t paying a lot of attention, says Jon Eguia, an applied game theorist at Michigan State University in East Lansing. “So in 2011, [those politicians] drew a lot of very bad maps in very many states. Now we’re all paying attention.”

Measuring bias

According to the U.S. Constitution and the Voting Rights Act of 1965, a state’s voting districts must each contain about the same number of people and be drawn in a way that doesn’t disenfranchise racial or ethnic minorities. States can have additional rules, such as contiguity of districts or that cities or counties be kept intact.

That leaves two main tactics for gerrymandering: “packing” the opposing political party’s supporters into a few districts in hopes your party dominates the rest, or “cracking” these supporters by spreading them across many districts to dilute their collective voting power. Those skilled in gerrymandering draw district boundaries that ensure decade-long protection for the ruling party.  

Early methods to test a state map for gerrymandering, which are still in use today, rely on a concept known as partisan symmetry. If a map provides symmetric, or equal, opportunity for all parties in a contest to convert votes into seats, that map is deemed fair. States with packed and cracked districts won’t pass tests based on symmetry.

Symmetry-based tests gained prominence after LULAC v. Perry, a 2006 Supreme Court case that reviewed a mid-decade redistricting plan in Texas. In that case, scientists entered into evidence a partisan bias test — a simulation of what would have happened in an election if the parties’ vote shares were reversed. For instance, if Party A wins 10 out of 15 seats with 70 percent of the vote in an actual election, then Party B, in a hypothetical election, should win 10 seats if it had 70 percent of the vote. Deviation from that “symmetry” equals the level of partisan bias.

In LULAC, the justices largely upheld Texas’ map. But the court indicated willingness to use a symmetry-based method in a future case, though perhaps not solely the partisan bias test. Justice Anthony Kennedy expressed concerns about that particular test, saying it was unclear how much bias was too much. Kennedy also questioned the method’s reliance on statistical simulations rather than real-world results. “We are wary of adopting a constitutional standard that invalidates a map based on unfair results that would occur in a hypothetical state of affairs,” he wrote in the plurality opinion for LULAC.

Real-world symmetry

Kennedy’s feedback on LULAC prompted researchers to develop other symmetry-based tests that used actual election results.

One such approach is the median-mean difference test. That test arises from the basic statistical principle that the difference between the median and the mean indicates the level of skew in the data, with values closer to zero less skewed and vice versa. In 2015 in the Election Law Journal, political scientists Michael McDonald and Robin Best of Binghamton University in New York explained how a median-mean analysis could help identify partisan skew in a state.

A party’s mean vote share comes from averaging vote shares across all districts in a state. A party’s median vote share comes from the district in the middle of a distribution, with the party’s worst-performing district in terms of vote share at one end and the best-performing district at the other. If the difference between a party’s median and mean vote shares is high, that indicates a possibly biased skew, though McDonald and Best noted that some natural skew is inevitable and must be factored into any analysis.

Another approach is called the efficiency gap, which measures the difference in packing and cracking between parties by tallying “wasted” votes. So, if Party A draws an electoral map that spreads Party B’s voters across districts, votes cast for Candidate B in districts won by A are wasted. Conversely, if Party A packs Party B’s voters into a few districts, votes cast for Candidate B beyond the majority needed to win are also wasted. Each party should have about the same number of wasted votes in an election. So the efficiency gap, first described in 2015 in the University of Chicago Law Review, is calculated by taking the difference in wasted votes between parties and dividing that by the total number of votes cast.

PlanScore, a nonpartisan group of legal, political and mapping experts, has shown how the various symmetry tests can be used in tandem to flag possible gerrymandering. In its analysis of the congressional map used in North Carolina’s 2018 congressional elections, where Republicans won 10 seats and Democrats three, PlanScore found bias using all three tests: The partisan bias test showed that in a hypothetical, tied election, Republicans would win 26.9 percent extra seats. In the median-mean test, the median Republican vote share was 5.8 percent higher than its mean vote share. And the efficiency gap was 27.7 percent in favor of Republicans.

Natural advantage

Critics of symmetry-based tests, though, say that the presence of packing and cracking does not prove that the governing party has intentionally gerrymandered the state’s districts. Instead, asymmetries can also arise from natural variations in where voters live. Crucially, Republicans tend to be more dispersed across states while Democrats are concentrated in cities.

“The party that’s more spread out has a geographic advantage,” says applied mathematician Jonathan Mattingly of Duke University. “That’s our system.”

Tests that have emerged over the last few years, known broadly as ensemble methods, accept that natural advantage. These tests rely on computers to generate thousands, or even millions, of possible maps. The programs draw myriad boundary lines around a given district and estimate which party would win that district under each scenario.

Consider a state in which one party wins four to seven seats in almost all maps generated, while the state is using a map that regularly gives that party nine seats, Eguia says. That discrepancy suggests partisan gerrymandering.

Lawyers working on gerrymandering cases tend to use ensemble and symmetry methods in tandem, says Ruth Greenwood, an attorney in Cambridge, Mass., with PlanScore and the nonpartisan nonprofit Campaign Legal Center. That’s because each alternative map can also be evaluated for symmetry using the various tests. Averaging symmetry scores in the ensemble maps and comparing those values with the symmetry scores of the real-life map can illuminate when the difference is stark and therefore can’t be chalked up to any “natural advantage.”

Using all methods together also means that when a map’s fairness is questioned, the lawyers can show that “on any metric, the result is terrible,” Greenwood says.

States at the helm

The issue of gerrymandering was weaving through the federal courts until June 2019, when the Supreme Court ruled 5–4 in Rucho v. Common Cause that partisan gerrymandering fell outside federal jurisdiction. The decision was in response to an appeal challenging a federal court’s January 2018 ruling that North Carolina’s congressional district map had been gerrymandered along partisan lines, giving Republicans 10 out of 13 seats in 2016 and 2018, despite the fact that in both elections Republicans won only about half the popular vote.

By removing the federal court system from gerrymandering cases, the Supreme Court left the issue to the states, a charge a North Carolina state court quickly took up in Harper v. Lewis. The state court relied on much of the same evidence presented in Rucho. That evidence included testimony by Mattingly showing that in a universe with 24,518 alternative congressional district maps, the map North Carolina was using was an egregious outlier. In the maps Mattingly generated, Republicans carried 10 or more seats less than 1 percent of the time.

In October 2019, the three-judge panel in the Harper case ruled that state lawmakers needed to redraw the congressional district map for 2020. Plaintiffs, however, then challenged the state’s remedial map, which would likely result in Republicans winning eight out of 13 seats. Mattingly again provided expert testimony, this time adding 57,202 more maps made using less stringent constraints than the first batch. His research showed a much more purple state, with a 7–6 or 6–7 party split arising in the majority of those alternative maps.

But with the state’s 2020 primary fast approaching, a state court approved the remedial map in December 2019. That new map will stand for only a short time, though. Along with every other state, North Carolina will go through redistricting again in 2021 after the census tallies are in. New Jersey and Virginia — which hold statewide elections in odd years — may struggle to finish their maps before the 2021 elections, since the census was delayed due to the pandemic.

Meanwhile, census watchers worry that the Trump administration’s recent decision to move the completion deadline for the population count from October 31 to September 30 could lead to undercounts among hard-to-reach groups, thereby affecting the placement of district boundaries.

Greenwood expects a spike in lawsuits, though now at the state rather than federal level, challenging the newly drawn maps. And a small cadre of researchers is now ready to serve as expert witnesses in those cases, Eguia says.

The upcoming mapmaking process doesn’t have to repeat the mistakes of a decade ago, he adds. In 2011, lawmakers drew maps largely behind closed doors without researchers present — resulting in a decade of lawsuits, he says. Why not, instead, bring researchers into the room, with their tests and myriad maps, from the get-go? “That’s what the community of experts would prefer,” he says. “That’s what I would advocate for.”

More Stories from Science News on Computing

From the Nature Index

Paid Content