This is the most comprehensive map of the moon’s geology yet

Cartographers merged Apollo-era maps and modern lunar observations to make the new graphic

false-color map of moon's surface

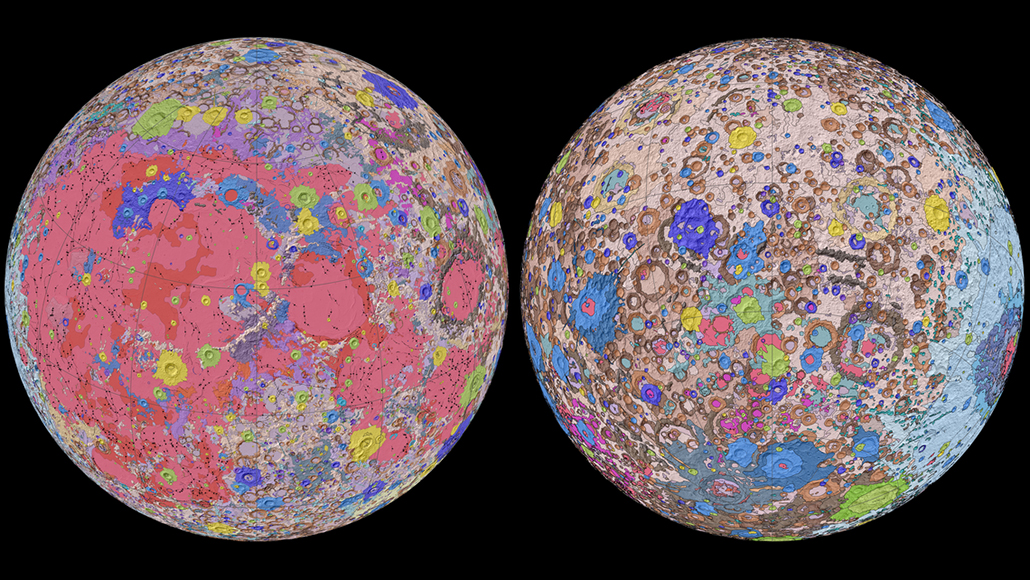
A new map of the moon is the most comprehensive geologic map of the lunar surface (nearside shown left, farside shown right). Different colors designate different surface features, such as lunar highlands (dark earth tones) and ancient lava flows (reds and purples).

GSFC/NASA, USGS

In the most comprehensive lunar map yet, the moon looks like it’s been playing paintball.

Each splash of color identifies a discrete rock or sediment formation, including craters, basins and ancient lava fields. For instance, “the darker, more earth tones are these highland-type terrains, and the reds and the purples tend to be more of these volcanic and lava flow materials,” says geologist James Skinner, who oversees the production of standardized maps for solar system bodies at the U.S. Geological Survey in Flagstaff, Ariz. (For more details on exactly what those colors mean, check out the map in all its glory here.)

The Unified Geologic Map of the Moon, released April 20 by the USGS, as it’s called, combines information from six regional lunar maps created during the Apollo era, as well as recent spacecraft observations. The modern data include views of the north and south lunar poles made by NASA’s Lunar Reconnaissance Orbiter, and observations around the equator from the Japanese Aerospace Exploration Agency’s SELENE lunar orbiter (SN: 7/10/19).

This lunar cartography project was trickier than just fitting Apollo-era maps together like puzzle pieces and using new data to tweak the details — in part, because the edges of the regional maps didn’t line up. Many surface features at the boundaries between neighboring maps were labeled with inconsistent names, descriptions and ages.

Different colors on a new geologic map of the moon designate different types of rock and sediment formations on the moon. For instance, craters associated with the Eratosthenian period on the moon (about 3.2 billion to 1.1 billion years ago) are typically marked green. Craters from the older Imbrian period (around 3.9 billion to 3.2 billion years ago) are generally painted blue.

Those discrepancies arose because the Apollo-era maps were created by separate research groups, and two different teams looking at the same parts of the moon could interpret what they saw differently. For instance, one group might have seen something jagged on the surface and called it a fault, whereas another team could have read it as a fragment ejected during the formation of a crater.

Skinner and colleagues reconciled those discrepancies by analyzing information from all six regional maps, along with the new lunar orbiter observations, to figure out the proper identifications for different surface features. That allowed the team to draw up a comprehensive geologic map of the whole moon.

Detailed observations from the lunar orbiters were especially helpful for clearing up uncertainties in how different craters overlapped with each other, which revealed the craters’ relative ages. Hammering out crater formation timelines gives insight into the moon’s history (SN: 3/26/18).

The new map could also inform future human missions to the moon by revealing regions that may be rich in useful resources or areas that need more detailed mapping to land a spacecraft there safely (SN: 12/16/19).

Previously the staff writer for physical sciences at Science News, Maria Temming is the assistant editor at Science News Explores. She has bachelor's degrees in physics and English, and a master's in science writing.

More Stories from Science News on Planetary Science

From the Nature Index

Paid Content