The squint method of data analysis

Mathematicians discover a Klein bottle hidden within the data underlying photographs

Data has a shape. But you’ve got to squint to see it.

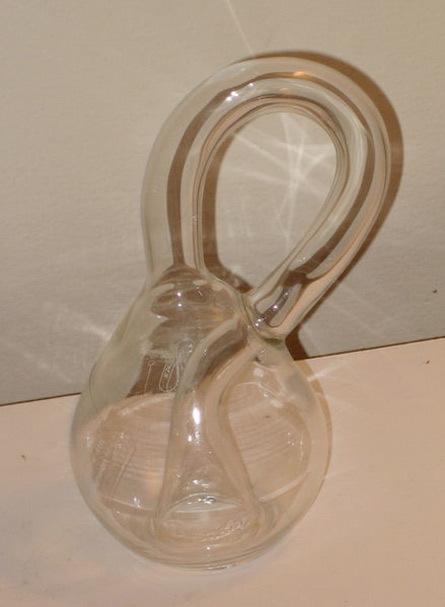
KLEIN BOTTLE A Klein bottle is a cylinder with its two ends glued to one another, but one of the ends is turned inside out first. Properly speaking, it doesn’t intersect itself, but the only way to visualize one in three dimensions is to allow it to do so, as in this model by . Wikimedia commons

INDISTINGUISHABLE For a topologist, a doughnut has the same shape as a coffee cup because you can stretch and squish one into the other. Click on the picture twice to see the coffee cup morph into a doughnut. Wikmedia commons

Take any example you like: health statistics of diabetics, the sequence of genes making up your genome, the rise and fall of financial markets. Turn that data into a multi-dimensional picture by plotting data points that are similar close together and ones that are very different far apart.

Now, squint. What shape do the data form? That shape may tell you about what the data mean. Doctors first analyzing data about diabetics found a big lump of fairly healthy folk along with two flares of sicker people, for example. That structure made them realize diabetes comes in two different forms.

Mathematicians have now found a far more complex shape when “squinting” at the data that makes up digital photographs. Hidden within, they discovered a Klein bottle, an odd mathematical surface with no edges, no inside and no outside. And their discovery may illuminate the way the brain makes sense of images.

To apply the “squint method” to photographic data, Gunnar Carlsson of StanfordUniversity and his colleagues had to overcome two major obstacles. First, because each pixel gets plotted in its own dimension, you’d need hundreds or even thousands of them. Good luck “seeing” in a thousand dimensions!

The next challenge is to formalize what it means to squint. Visually, squinting allows us to smear points together, filling in the gaps to see a whole shape. But mathematically, it’s not obvious how best to do this.

Happily, one of the most abstract areas of mathematics has the precise tools for the job. The field of topology could, in fact, be called the mathematics of high-dimensional squinting.

Topologists study geometric shapes just as geometers do. But a geometer thinks two mathematical objects are the same only if you can pick one up and put it on top of another, the two shapes line up exactly, with no bending or stretching or monkey business of any kind. That’s not very useful for studying data, which tend to be noisy and imprecise to begin with.

Topologists, on the other hand, are perfectly happy allowing objects to be stretched or squished, as long as you don’t punch any holes or glue anything together. So for a topologist, a doughnut and a coffee cup with a handle have the same shape. The cup part can be squashed, leaving just the handle to form a loop – the same general shape as a doughnut.

“Topology is a less sensitive and more qualitative way of looking at things than geometry,” Carlsson says. And this blurry vision is just right for data analysts seeking the meaning in a mess of data.

Furthermore, topologists have built theoretical tools to recognize these rough shapes of very high-dimensional objects. Carlsson and his colleagues have turned these theoretical tools into computer data-analysis tools.

To analyze photographic data, he first simplified the problem as much as possible by focusing in on tiny areas of a digital picture, three pixels by three pixels. He plotted the grayscale value of each pixel on its own axis. Since each patch had a total of nine pixels, that meant that he needed a nine-dimensional space. That’s impossible to see, but not hard to perform calculations about.

In theory, a patch could have any combination of shades in each of those nine pixels, but Carlsson found that most combinations rarely occurred. That’s not surprising because if you randomly assign a shade to each of the pixels, the result will usually look like noise, rather than looking like a portion of a meaningful object. So it won’t often occur in a photograph.

That means that the points he plotted filled up only a portion of the full nine-dimensional space. Carlsson wanted to know if those plotted points created a shape — in a squinty, topological sense.

And indeed, he calculated that they formed the remarkable shape of a Klein bottle.

The finding may pave the way to more advanced methods of compressing photographic data, Carlsson says. Furthermore, cells in the brain’s primary visual cortex are tuned to pick up the very patches that are most important in the structure of the Klein bottle, suggesting the brain itself may use a similar sort of “compression algorithm” to quickly pull information from what it sees.

More Stories from Science News on Math