EPA underestimates methane emissions

Rising amounts of greenhouse gas missed by environmental agency’s methods

gas well

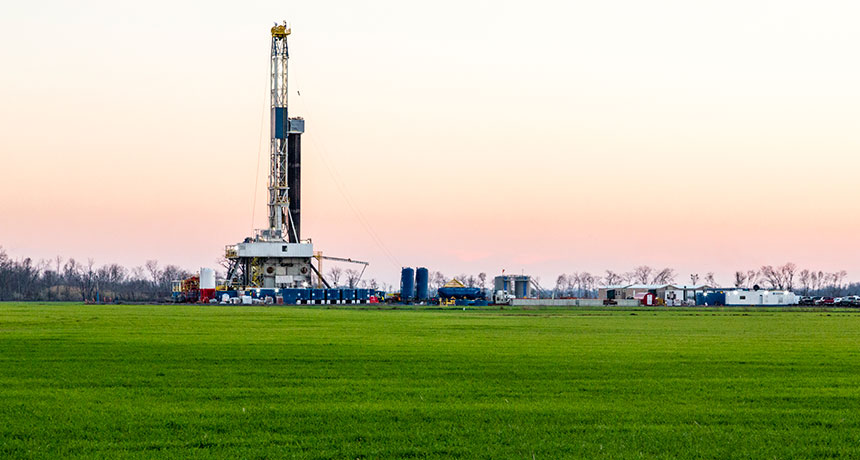
MISSING METHANE  Environmental Protection Agency reports underestimate U.S. methane emissions, new studies show. That discrepancy could stem from a small number of methane sources such as leaky natural gas wells that release a disproportionate amount of the greenhouse gas.

Daniel Foster/Flickr (CC BY-NC-SA 2.0)

The U.S. Environmental Protection Agency has a methane problem — and that could misinform the country’s carbon-cutting plans. Recent studies suggest that the agency’s reports fail to capture the full scope of U.S. methane emissions, including “super emitters” that contribute a disproportionate share of methane release. Those EPA reports influence the country’s actions to combat climate change and the regulation of methane-producing industries such as agriculture and natural gas production.

With EPA’s next annual methane report due to be published by April 15, early signs suggest that the agency is taking steps to fix the methane mismatch. A preliminary draft of the report revises the agency’s methane calculations for 2013 — the most recent year reported — upward by about 27 percent for the natural gas and petroleum sectors, a difference of about 2 million metric tons.  

Yet it’s unclear how that and other revisions will factor into final methane emission totals in the upcoming report. The draft estimates that U.S. methane emissions from all sources in 2014 were about 28 million metric tons, up slightly from the revised estimate for 2013 and well above the original 2013 estimate of 25.453 million metric tons. But the totals in the draft don’t include updates to emission estimates from the oil and gas industry.

MASSIVE LEAK Methane spewed from an underground reservoir in Southern California earlier this year before the leak was finally sealed, as seen in this sped-up infrared footage. California Air Resources Board/YouTube

“EPA is reviewing the substantial body of new studies that have become available in the past year on the natural gas and petroleum sector,” says EPA spokesperson Enesta Jones. The agency is also gathering feedback from scientists and industry experts to further improve their reporting.

Methane, which makes up the bulk of natural gas, originates from natural sources, such as wetlands, as well as from human activities such as landfills, cattle ranches (SN: 11/28/15, p. 22) and the oil and gas industry. Globally, human activities release about 60 percent of the 600 million metric tons of methane emitted into the atmosphere each year. Once in the air, methane prevents some of Earth’s heat from escaping into space, causing a warming effect. Methane emissions currently account for about a quarter of human-caused global warming.

The EPA’s underestimation of U.S. methane emissions comes down to accounting. EPA samples emissions from known methane sources, such as cows or natural gas pipelines, and works out an average. That average is then multiplied by the nation’s number of cows, lengths of pipe and other methane sources. Results from this method disagree with satellite and land-based observations that measure changes in the total amount of methane in the air. A 2013 report in the Proceedings of the National Academy of Sciences found that U.S. methane emissions based on atmospheric measurements are about 50 percent larger than EPA estimates (SN Online: 11/25/13).

EPA’s reports don’t just misjudge the scale of emissions, they also miss the long-term trend, recent work suggests. EPA reported that U.S. methane emissions remained largely unchanged from 2002 to 2014. But researchers report online March 2 in Geophysical Research Letters that emissions of the greenhouse gas rose more than 30 percent over that period. The United States could be responsible for as much as 30 to 60 percent of the global increase in methane emissions over the last decade, the study’s authors conclude. “We’re definitely not a small piece of that pie,” says Harvard University atmospheric scientist Alex Turner, who coauthored the study. 

Correctly tracking methane is important, Turner says, because over a 100-year period, the warming impact of methane is more than 25 times that of the same amount of CO2. Methane levels have also risen faster: Since the start of the industrial revolution, methane concentrations have more than doubled while CO2 has risen more than 40 percent.

While methane is more potent than CO2, there is about 200 times less methane in the atmosphere than CO2. Furthermore, methane stays in the atmosphere for only around 12 years before being absorbed by soil or breaking apart in chemical reactions. “If we reduce methane emissions, the climate responds very quickly and global warming would slow down almost immediately,” says Cornell University earth systems scientist Robert Howarth. “CO2, on the other hand, has an influence that will go hundreds to even thousands of years into the future.”

Turner and colleagues tracked methane across the continental United States using land stations that measure methane in the air and satellite observations that record dips in the infrared radiation frequencies absorbed and reemitted by methane. The researchers compared these methane measurements with those taken over Bermuda and the North Pacific Ocean — places upwind of the United States and far from major methane sources.

From 2002 through 2014, methane concentrations over the continental United States grew faster than those over the oceans, the researchers found. The difference was most pronounced over the central United States, where methane concentrations rose nearly twice as fast as in the rest of the country. Natural gas drilling and production boomed in in the central United States during the period studied, though the researchers could not precisely trace the source of the additional methane.

Turner and colleagues say they’re now working with EPA to reconcile the methane estimates. EPA will provide small-scale estimates of methane emissions down to a 10-kilometer-wide grid. By combining that grid with space and land observations, scientists should be able to isolate where methane mismatches are the most pronounced.

While Turner’s research can’t pinpoint the exact origins of the additional methane, other studies point to the oil and gas industry. The numbers that the EPA uses to tabulate methane emissions assume that equipment is functioning as intended, says Stanford University sustainability engineer Adam Brandt. Malfunctioning equipment can spew huge amounts of methane. That became abundantly – and visibly – clear last October when the largest U.S. methane leak in history began in an underground storage facility near Los Angeles. The leak released 97,100 metric tons of methane, equivalent to the annual greenhouse gas emissions of 572,000 cars, before being permanently sealed in February, researchers estimated in the March 18 Science.

Super methane emitters are a big problem elsewhere, too, albeit typically much smaller than the California leak, researchers report in the June 2016 Environmental Pollution. Surveying emissions from 100 natural gas leaks around Boston, the researchers found that 7 percent of leaks contributed half of the total methane released. In 2014, a different research team reported in Environmental Science & Technology that 19 percent of pneumatic controllers used at natural gas production sites accounted for 95 percent of all controller emissions.

Monitoring and quick repairs can stamp out rogue methane sources quickly, Brandt says. “This is a problem that’s easier to fix than it is to understand,” he says.


Editor’s note: This story was updated April 26, 2016, to correct the percentage by which COin the atmosphere has risen since the start of the industrial revolution.

More Stories from Science News on Environment

From the Nature Index

Paid Content