HOT ERA Across 98 percent of Earth, the end of the 20th century saw the hottest temperatures of the last two millennia. Since then, average global temperatures are still increasing, causing record-breaking heat waves such as struck New York City (shown) in mid-July.
Jeenah Moon/Bloomberg via Getty Images
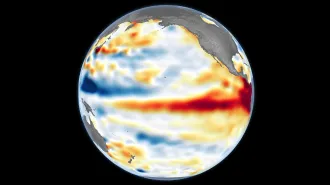
Temperatures across 98 percent of Earth’s surface were hotter at the end of the 20th century than at any time in the previous 2,000 years.
Such nearly universal warming, occurring in lockstep across the planet, is unique to this current era, scientists say. By contrast, other well-known cold and warm snaps of the past, such as the Little Ice Age or the Medieval Warm Period, were, in fact, regional rather than worldwide.
What’s more, the rate at which temperatures are increasing now far exceeds any previous temperature fluctuations measured in the last two millennia. Those are the conclusions of a trio of new papers examining temperature trends over the last 2,000 years, published online July 24 in Nature and Nature Geoscience. Those previous climate fluctuations were primarily driven by natural causes, including powerful volcanic eruptions, rather than human-caused greenhouse gas emissions.
The findings, which are based on newly available global paleoclimate data, reinforce an inescapable conclusion, says Michael Mann, a climate scientist at Penn State University who was not involved in the new studies: “The current period of warmth is unprecedented in its global scope in the last 2,000 years.”
In the Nature study, a team led by Raphael Neukom, a climate scientist at the University of Bern in Switzerland, used many different types of temperature records from around the world to create thousands of climate reconstructions of the last two millennia, from A.D. 1 to 2000. Those data were collected by an international group of scientists called the PAGES 2k Consortium. They include proxies for temperatures derived from tree rings, glacier ice cores, lake and ocean sediments, cave deposits such as stalactites and stalagmites and historical documents (SN: 10/28/17, p. 29).
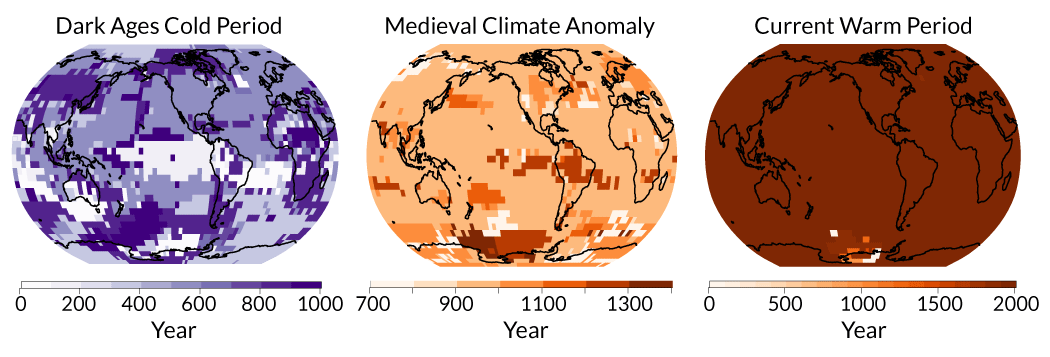
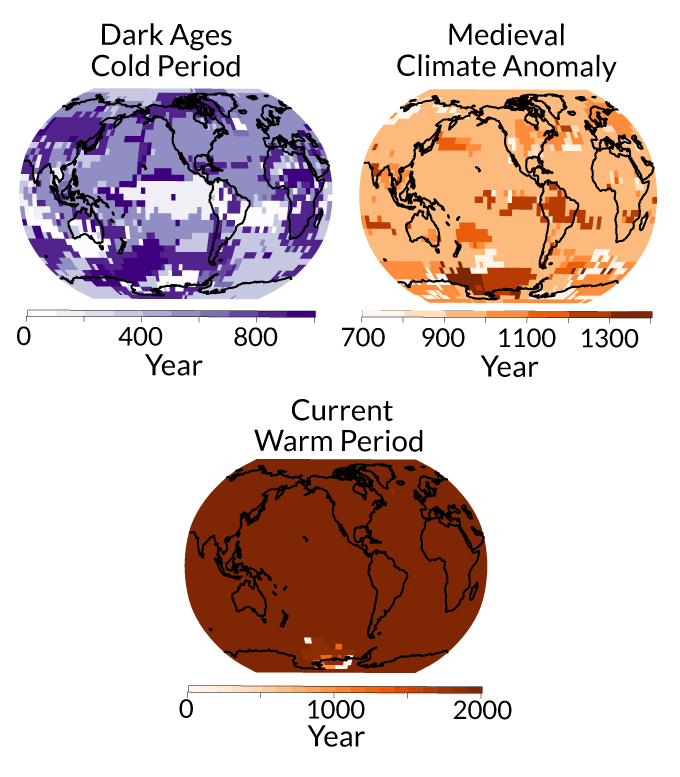
Using those data, as well as direct temperature measurements collected in some locations since the 1800s and some climate simulations, the team produced more than 15,000 different climate reconstructions of past global temperatures. Then, the researchers took a close look at the precise timing of warming or cooling within four previously identified “climate epochs” — the Roman Warm Period from about A.D. 1 to 300, the Dark Ages Cold Period from 400 to 800, the Medieval Warm Period from about 800 to 1200 and the Little Ice Age from 1300 to 1850.
Hot and cold
Well-known climate fluctuations of the last 2,000 years were once thought to be global. But research using newly available temperature proxy data from around the planet reveals that these fluctuations were regional. In each map, different colors represent the warmest (or coldest) century for a given location within the represented time period. For example, the Dark Ages Cold Period is thought to span from about A.D. 400 to 800. But colder temperatures occurred several hundred years earlier in the Pacific Ocean (white to pale purple) and several hundred years later in East Asia and other locations (darker purple). Similarly, the Medieval Warm Period (or Medieval Climate Anomaly) lasted roughly from 800 to 1200, with peak warmth occurring during the 11th century in northwestern Europe (orange). But central South America saw peak warmth several hundred years later (brown). Across all 2,000 years included in the new research, however, temperatures were hottest at the end of the 20th century for 98 percent of the planet (shown in the third map).
Cold and warm snaps of the past were regional, unlike current global warming
Although the same datasets were input into the climate reproductions, the team used different methodologies, varying widely in computational complexity, to process the data and calculate past temperatures. Regardless of which method was used, the story was the same, the researchers found: Those past climate epochs were not simultaneous, global events.
The Little Ice Age, for example, was a cold snap thought to have lasted from roughly 1350 to 1850. But the deep freezes didn’t occur everywhere at the same time, the new analysis shows. Northwestern Europe and southeastern North America got their coldest temperatures during the 17th century, while the area encompassing the central and eastern Pacific Ocean were coldest two hundred years earlier, during the 15th century, the team found.
The Medieval Warm Period, also called the Medieval Climate Anomaly, showed the warmest temperatures in northwestern Europe and eastern North America during the 11th century. But peak warmth occurred several hundred years later in central South America, and several hundred years earlier in the eastern and central Pacific Ocean.
“The traditional understanding is that these [climate epochs, like the Little Ice Age] were global-scale phenomena,” says Nathan Steiger, a climate scientist at Columbia University. “That’s not the case.”
That finding stands in stark contrast to the team’s conclusions about the current era of warming: It is occurring concurrently around the globe, with the hottest temperatures in the study found to be right at the end of the 20th century. “It is coherent in a way we didn’t experience over the last 2,000 years,” Steiger says.
Because the study’s temperature data go only to 2000, the last two decades of temperatures weren’t included. But NASA and the National Oceanic and Atmospheric Administration reported in February that nine of the 10 warmest years on record have occurred since 2005, and the last five years were the five hottest on record (SN Online: 2/6/19). Human activities have been repeatedly cited by scientists as the cause of these ongoing record-breaking temperatures (SN Online: 7/2/19).
At a news conference on July 22, Steiger noted that the Nature study didn’t specifically mention that the current warming is due to anthropogenic activities, in part because so many previous studies have repeatedly and clearly demonstrated that link. “We don’t need to look at paleoclimate to know that.”
A second study, published in Nature Geoscience, does address the question of anthropogenic warming more explicitly. The study, authored by Neukom and other members of the PAGES 2k Consortium, used the same temperature proxies as the Nature study. But instead of comparing spatial patterns of warming and cooling around the globe, the team looked at the average global temperature through time.
That, Neukom said at the news conference, revealed that the current rate of warming is much faster than anything observed in the last 2,000 years that can be attributed to natural variability. “It’s another angle to look at the extraordinary nature of current warming,” he said.
A third study, also in Nature Geoscience, added another layer of context to the trends, by looking at what natural forces may have been behind large regional temperature fluctuations such as the Little Ice Age.

Led by University of Bern climate scientist Stefan Brönnimann, the researchers found that before the onset of the Industrial Revolution in the mid-1800s, powerful volcanic eruptions were the main engine behind such large-scale temperature fluctuations. For instance, five powerful eruptions, including the 1815 eruption of Mount Tambora, occurred toward the end of the Little Ice Age, which began around 1350 and ended around 1850 (SN: 7/7/18, p. 32).
The eruptions initially led to cooling and climate upheaval, and then a period of recovery as the planet warmed up again. That recovery coincides with the onset of the Industrial Revolution, at which point greenhouse gases became the primary driver for warming, the researchers note.
Mann notes that the studies’ findings — that these past climate epochs weren’t global and that current warming is proceeding at an unprecedented rate — aren’t exactly new ideas. In 1998, he and colleagues published a famous study in Nature, sometimes referred to as the “hockey stick” paper, that revealed a dramatic upward tick in temperatures at the end of the 20th century — a pattern that, when plotted through time, takes the shape of a hockey stick. “It’s gratifying that independent, international teams using entirely different approaches have come to virtually identical conclusions,” Mann says.
Raymond Bradley, a climate scientist at the University of Massachusetts Amherst who coauthored the hockey stick study, agrees. “In that paper, we were widely criticized for saying the last decade was the warmest in the last 1,000 years,” he says.
Bradley adds that the new studies are a valuable addition, with a “high quality, carefully screened set of data” as well as powerful simulations that can synthesize and reproduce those past temperatures. “They’ve done everything right,” he adds.
But the PAGES 2k database of temperature proxies still contains some glaring holes, particularly in tropical regions and in the oceans. Such data won’t change the underlying storyline, but could help scientists see global temperature fluctuations even more clearly, Bradley says. Efforts to collect more temperature data from South America are already afoot, from cave formations across Brazil and Argentina as well as from ancient trees in the Amazon forest, he adds, and “that’s exactly what’s needed.”