Second in a two-part series on the sun-Earth connection. Part one available at Stormy Weather.
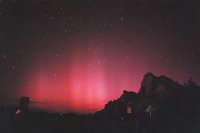
The solar flares that spew massive amounts of energy and particles earthward are notorious for the havoc they can wreak on satellites, power grids, and our planet’s magnetic field (SN: 1/13/01, p. 26: Available at Stormy Weather). The charged particles that slam into the outer fringes of the atmosphere also ionize the air and stimulate shimmering auroras. During periods of increased solar activity, particularly during highpoints of the 11-year sunspot cycle, these breathtaking sky shows often appear far south of their normal Arctic venues.
Strong solar activity can also have substantial short-term influences by cooling the atmosphere in some places and heating it in others. These meteorological effects typically last days or weeks. But many scientists propose that changes in the sun’s magnetic field and radiation output during its 11-year cycle of activity also have longer-term effects. They influence the movement of weather systems and other aspects of atmospheric and climate patterns.
It’s tough to discern the subtle climatic effects of solar variation amidst a cacophony of strong earthly influences–greenhouse gases, volcanoes, sulfate aerosols, to name a few. But using sophisticated statistical analyses of an ever-growing stockpile of climate and weather data, scientists say they’re uncovering ways in which even small variations in solar activity could have big effects down at ground level.
Solar storms
Intense solar activity has substantial short-term effects that can shape Earth’s weather. Consider the magnetosphere, which swaddles the planet at altitudes between 1,000 and 6,000 kilometers. I’s composed of thick layers of charged particles—primarily protons and electrons—trapped in space by Earth’s magnetic field. When a strong solar flare delivers a jolt to these belts, it can shake loose a torrent of these charged particles. Auroras, which at times of increased solar activity sprawl across the sky more often than average, are merely one result of this ionic rain upon the upper atmosphere.
An especially powerful type of solar eruption, known as a coronal mass ejection, can inject protons directly into Earth’s atmosphere. As these high-energy solar protons rain down, they pummel the air like subatomic bullets. The kinetic energy of these charged particles may warm the outer layers of the polar atmosphere by several degrees, says Charles H. Jackman, an atmospheric scientist at Goddard Space Flight Center in Greenbelt, Md. This heating—which typically lasts just a few days, Jackman says—primarily affects the air at heights above 50 km.
At altitudes from 30 to 90 km, the energetic particles also split molecules of nitrogen into nitrogen atoms, which then react with oxygen in the air to form ozone-destroying compounds. This occurs mainly at polar latitudes, where most of the charged particles have spiraled in along lines of the Earth’s magnetic field. Because ozone absorbs ultraviolet (UV) light, the depletion of ozone can cause the atmosphere to cool.
During a large solar storm, a portion of the upper stratosphere in the polar regions can lose up to 20 percent of its ozone and cool as much as 3ºC, an effect that can last for several weeks. Jackman is quick to emphasize that such solar activity is not the cause of the infamous “ozone holes,” which occur at lower altitudes and are aggravated by chemicals such as chlorofluorocarbons.
Driving Earth’s climate
Not only do solar storms influence day-to-day weather, but long-term, subtle variations in solar activity drive Earth’s climate, scientists propose. Satellite data show that, overall, the amount of radiation Earth actually receives from the sun varies little between the maximum and minimum phases of the 11-year solar cycle.
When measured across all wavelengths of light, the total radiation reaching the planet changes only about 0.1 percent during the cycle, says Rodney A. Viereck, a space physicist at the National Oceanic and Atmospheric Administration in Boulder, Colo. However, the amount of change in solar irradiance at Earth isn’t consistent across all wavelengths, Viereck notes. For example, the type of UV radiation that converts oxygen molecules into stratospheric ozone varies as much as 8 percent during the solar cycle.
At yet-shorter UV wavelengths—the ones that create the ionosphere, which is the layer of the atmosphere that lies above about 80 km in altitude—the disparity is even larger. During a solar maximum, Earth receives more than five times the amount of radiation in these far-UV wavelengths than it gets during a solar minimum.
The significant differences in UV irradiance at Earth during the solar cycle have profound effects in the upper levels of the atmosphere because the air density there is low, says Viereck. As these layers absorb radiation, they heat and expand upward, reaching high enough to slow satellites in low Earth orbit. Such spacecraft, which circle Earth at altitudes of 250 to 600 km, need to be boosted in their orbits more often during solar maxima than at other times, he adds.
Down at Earth’s surface, the variations in solar irradiance during a solar cycle are relatively small. Many of the wavelengths whose intensities vary significantly are absorbed at higher altitudes, so they never reach the ground. Although no specific mechanism has been proposed to explain how solar activity might influence weather and climate, the solar cycle matches up with many earthbound patterns, says Judith Lean, a solar physicist at the Naval Research Laboratory in Washington, D.C. She recently reviewed data from a wide variety of research efforts. The list of phenomena following the 11-year cycle includes the frequency of rainfall in Africa, forest fires in North America, and hurricanes in the North Atlantic.
Another example of an apparent solar influence on climate is the 11-year cycle of annual temperatures in Alaska. Using Fairbanks and Anchorage weather data extending back to 1919, R. Suseela Reddy, a climatologist at Jackson (Miss.) State University, found that the annual average temperatures at the sites were lower during solar maxima and higher during solar minima. Reddy presented his research at the American Meteorological Society’s annual meeting in Albuquerque this month.
At the same meeting, Alfred M. Powell Jr., an atmospheric scientist with Autometric in Springfield, Va., described a mechanism that he believes links changes in UV radiation that heat the upper atmosphere to effects on the weather at ground level.
According to Powell, as stratospheric ozone absorbs heat, the boundary between the stratosphere and the troposphere—the lowest atmospheric level, where all the weather happens—is driven to lower altitudes. In effect, Powell says, this clamps a lid on the weather systems in the troposphere. Low-pressure systems grow stronger and more quickly, and they last longer.
The lowered boundary also changes the circulation of air from the stratosphere downward into regions of low pressure, which, in turn, affects the flow patterns that steer weather systems. Previous research has shown that at solar maxima, weather systems are driven along a more southerly path and are stronger. Powell�s model reproduces these characteristics.
Climate changes
Only for the past two solar cycles have scientists used satellites to make direct measurements of the 11-year variation in radiation reaching Earth. It turns out, however, that these changes in irradiance correlate closely with the sunspot number, which astronomers have been measuring for hundreds of years. This correlation enables climate researchers to look at sun-climate connections well into the past.
In particular, scientists are interested in explaining climate changes since the Industrial Revolution began to spew carbon dioxide and other so-called anthropogenic greenhouse gases into the atmosphere. A team led by Peter A. Stott, a climate scientist at the Hadley Center for Climate Prediction and Research in Berkshire, England, used a computer to model the changes in global average temperature since 1860. Greenhouse gases can’t fully explain the climate patterns of the past century, the team reported in the Dec. 15, 2000 Science.
Even though carbon dioxide and other greenhouse gases have been rising constantly for the past 150 years, global average surface temperatures during that time have shown extended periods of both warming and cooling. After a period of warming early in the century, slow but steady global cooling began in the 1940s. It continued until the mid 1970s, when warming seems to have kicked in and overtaken the cooling trend.
Stott says that anthropogenic emissions alone could explain the rapid rise in temperatures in the past 30 years and that solar variation alone could have caused the warming observed between 1910 and 1940. However, neither natural nor anthropogenic causes alone could explain temperature patterns throughout the entire century. A model that includes both causes could explain up to 60 percent of the temperature fluctuations measured on land, Stott notes. The rest of the fluctuation can be attributed to normal year-to-year variations, he adds.
Although these results show that the solar variation can be a major contributor to climate change, Stott says he expects rising anthropogenic emissions to increasingly dominate as a cause of global warming.
Francis W. Zwiers, an atmospheric scientist at the Canadian Center for Climate Modeling and Analysis in Victoria, B.C., finds the British team’s results compelling. In most runs of Stott’s computer model, which uses a random statistical process in its calculations, changes in solar irradiance were needed to duplicate the century’s temperature patterns, he says. Only in a few runs did natural year-to-year variation explain the climate changes.
Gerald R. North, a climatologist at Texas A&M University in College Station, contends that the effect of solar variation is so small that it’s of no practical significance. This effect is “no more that a few hundredths of a degree…a faint signal in a noisy system,” he says.
Teasing out the individual contributions of solar variation, greenhouse gases, and other factors to a complicated cycle of temperature changes is a “giant statistical problem,” North says. “You’ve got to use pretty sophisticated statistical methods in these analyses, and the results can fool you really easily if you don’t understand what you’re looking at.”
Still, he notes, there’s overwhelming evidence that Earth is warming. His models show with a 75 percent certainty that solar variation is contributing 10 to 20 percent of the temperature rise of a fraction of a degree. This small change, he contends, is useful only as a theoretical test for climate models.
Other scientists also have a tough time believing that just a small variation in solar irradiance over an 11-year period could have a strong effect on climate. “They’ve said, ‘It just can’t be,'” says NOAA’s Viereck.” But even some of the strongest nay sayers are starting to recognize that there’s something there.”
One man who may convert more naysayers to yea-sayers is John K. Lawrence, a physicist at California State University in Northridge. Lawrence and his colleagues used what he calls “an extremely crude model” of three interrelated equations to simulate the flow patterns in the atmosphere at middle latitudes.
Although simple, the model incorporates all of the basic physics equations needed to describe one aspect of the atmospheric flow around Earth. Researchers using this model can add input that simulates variations in solar radiation.
The model calculates the average speed of the westerly flow of winds in the atmosphere as a function of latitude. This number provides a crude estimation of the speed of the jet stream that drives weather systems from west to east.
“It’s a good general circulation model,” says Lawrence. “But if you want to predict the weather in Scotland 2 years from now, this model won’t do it.”
What the model does do, Lawrence says, is show that even a simple system of equations can answer many of the criticisms directed against those who say solar variation is an important factor in explaining significant global temperature changes.
For one thing, the model exhibits what physicists call chaotic behavior–even small changes in the inputs to complex systems can cause large variations in the answers (see “The Changes of Wind,” below). This, Lawrence notes, helps bolster the claim that a 0.1 percent variation in solar irradiance can, in fact, significantly affect climate.
Second, the model’s calculations produce correlations that appear during the early phases of a simulation, disappear later in the simulation, and then reappear as anticorrelations. This matches the past behavior of the solar cycle. Between 1860 and 1920, cooler temperatures occurred when sunspot numbers were large. From the 1920s to the 1960s, there was no clear correlation between sunspot numbers and temperature. But after 1960, increased sunspots correlated with higher temperatures, Lawrence notes.
Finally, Lawrence’s model allows the Northern and Southern Hemispheres to fluctuate independently of one another and to have different correlations to the solar variation, as has been observed.
“Most scientists try to explain these things by creating incredibly detailed models and then solve them by brute force with lots of computer power,” says Lawrence. “We’re saying it’s plausible to get big, complex effects from a remarkably simple model.”
For example, small variations in solar irradiance may drive big changes in climate. He adds: “Whether the climate actually works this way is another story.”
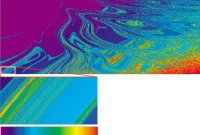
The Changes of Wind
Output of a climate model that suggests even small variations in solar irradiance may drive big changes in climate: The image above shows a plot of average westerly wind speed as a function of the heating contrast between high and low latitudes (horizontal axis) and eddy forcing (vertical axis), a parameter that can represent the heating differences between land and sea. For some combinations of the two parameters, such as those represented in the upper left corner of the larger image, average wind speeds remain relatively stable. For other combinations, such as those shown in the lower left corner (a region shown magnified in the inset at left), even minuscule changes in input can cause significant fluctuations in average wind speed.