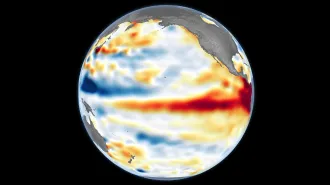
If a magnitude 7.7 earthquake struck near Los Angeles on the San Andreas fault, where would its most destructive vibrations occur? About 20 seconds after such a quake, the strongest ground motions would be in the yellow and green areas of this image.
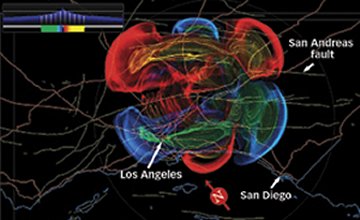
It depicts one component of ground motion predicted by a new model. Red and yellow indicate small and large movements, respectively, toward the southeast; blue and green represent small and large movements in the opposite direction.
Researchers often study single components of ground motions to assess temblors’ effects on buildings or other structures, says Philip Maechling of the Southern California Earthquake Center in Los Angeles. He and his colleagues at that nine-university consortium just completed the TeraShake project, a 6-month effort to model multiple components of an earthquake’s effects across a 180,000-square-kilometer region of southern California. It took a supercomputer 3 days to simulate the first 220 seconds after the quake.