![]()


Amazingly simple mathematical operations can lead to intriguingly complex results.
Consider, for instance, the iterative geometric process of creating flaky pastry dough. Flatten and stretch the dough, then fold it over on top of itself. Do it again and again and again. Repeating the pair of operations–stretch and fold–just 10 times produces 1,024 layers; 20 times, more than a million.
In dynamical systems theory, the so-called baker’s map, or transformation, does nearly the same thing. Here’s one special case of that transformation: Start with a square. Stretch it to twice its original length while making it half as wide. Cut the result in half, and stack one half on top of the other to return the combination to the square’s original dimensions.
Notice that the square’s area is preserved, but its components are rearranged. Indeed, applying this transformation repeatedly has the effect of jumbling whatever image may be drawn within the square. If that image happens to be a grinning feline, you end up with a madly scrambled cat.
During the mixing process, it occasionally happens that some of the square’s points come back close to their initial locations within the square. For an instant, some form of the original image would flash into view before vanishing again into a murky, nearly homogeneous sea.
This surprising reappearance is an example of a phenomenon known as Poincaré recurrence, named for the French mathematician Henri Poincaré (1854–1912). In essence, if a transformation is applied repeatedly to a mathematical system and the system cannot leave a bounded region, it must return infinitely often to states near its original state.
In 1986 for an article on chaos in Scientific American, Bill Sanderson and James P. Crutchfield created a striking illustration of Poincaré recurrence, applying a certain stretching operation (sometimes called Arnold’s cat map) to a digitized portrait of Poincaré.
At each step, a computer stretches the image diagonally as if it were printed on a sheet of rubber. Any portion of the image that extends past the original border is cut off and reinserted elsewhere. Most of the time, successive iterations of the stretching process produce diagonal streaks or seemingly random splotches of color. Once in a while, however, the original image reappears.
When Bob Brill of Ann Arbor, Michigan, first saw this sequence of images, he was fascinated. “Stirring an image into a soup only to see that more of the same treatment restored it was like seeing the dead come to life,” he observed.
A professional computer programmer, Brill decided to explore this phenomenon for its potential in creating artful images. Though he hadn’t started out as an artist, he had been teaching himself how to turn a computer into an artist’s tool ever since he had bought his first personal computer in 1983.
Two articles by A.K. Dewdney in Scientific American–one featuring vivid depictions of the Mandelbrot set and another describing computer algorithms and formulas for generating “wallpaper for the mind”–ignited Brill’s interest in algorithmic art. “That got me started, and I’ve been hooked ever since,” he says.
To create an image, Brill writes a simple program in a special computer language he developed and named E in honor of Dutch graphic artist M.C. Escher (1898–1972). His DOS-based, menu-driven “E-Run” software executes the program and generates the picture.
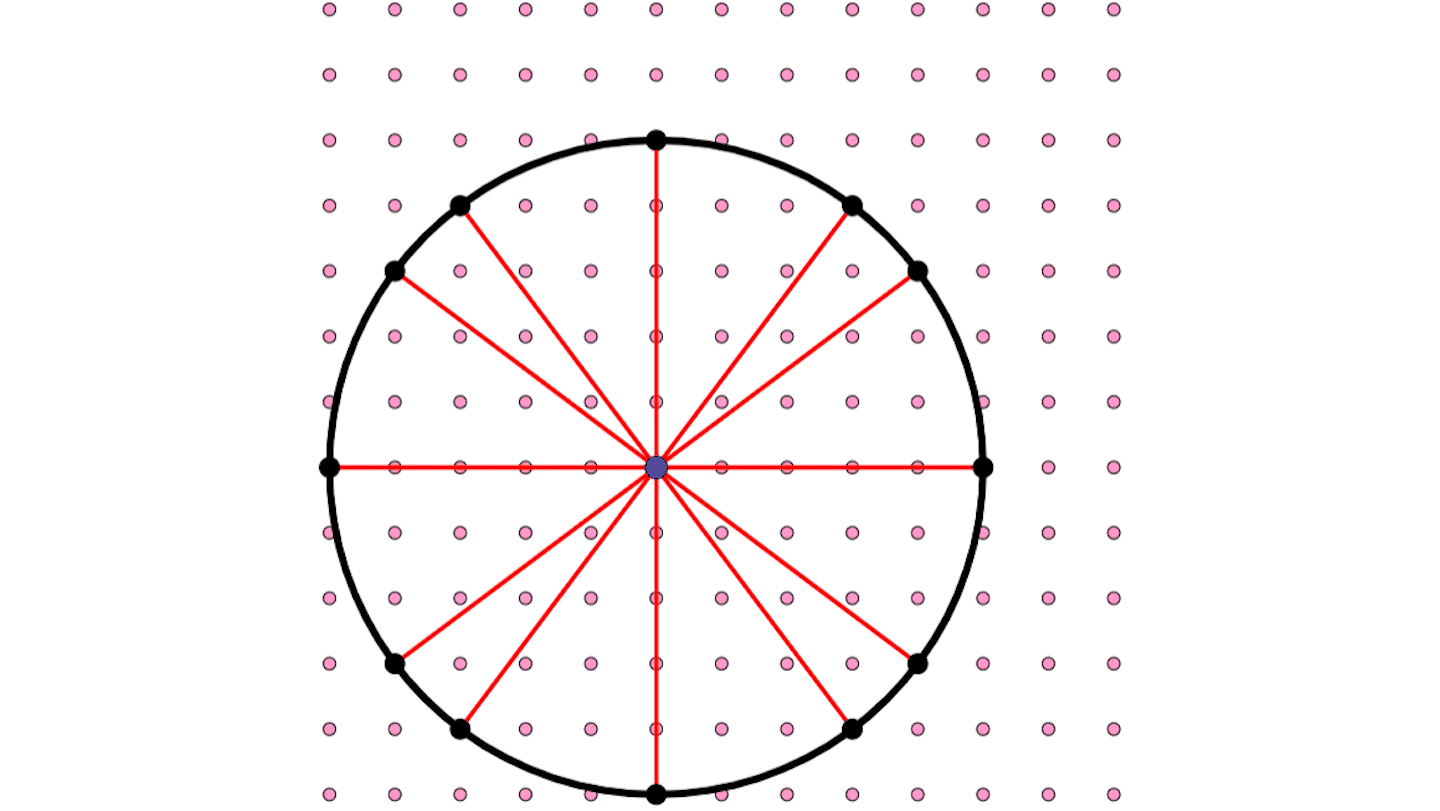
One of Brill’s favorite strategies involves applying area-preserving transformations to grids, where each box of the grid can be as small as a single pixel on a computer monitor. His algorithm specifies where all the boxes go with each application of a given transformation.
For example, suppose you decide to use a 4 x 3 grid, with its boxes numbered as follows:
| 1 | 2 | 3 | 4 |
| 5 | 6 | 7 | 8 |
| 9 | 10 | 11 | 12 |
One possible transformation shuffles the boxes so that the numbers now start in the lower right corner, increasing as you go up and to the left. So 1 goes to where 12 was, 2 goes to where 8 was, and so on, as shown in the table below.
| 1 | 2 | 3 | 4 | 5 | 6 | 7 | 8 | 9 | 10 | 11 | 12 |
| 12 | 8 | 4 | 11 | 7 | 3 | 10 | 6 | 2 | 9 | 5 | 1 |
Notice that boxes 1 and 12 simply exchange places with each application of the transformation. The remaining boxes each cycle through 2, 8, 6, 3, 4, 11, 5, 7, 10, and 9. In this particular instance, the original image reappears after 10 iterations.
The idea is to color the boxes to create some sort of pattern, then apply the transformation again and again to see what happens.
Suppose the starting configuration consists of three horizontal bars, each one a different color (below, left). Each successive application of the transformation shuffles the boxes to create a new pattern.
In the following sequence of images, Brill applied the same transformation repeatedly to a starting pattern (below, left) in a 403 by 399 rectangle. In this case, the repeat cycle is 6,580.
The majority of steps produce boring, nearly structureless images. “To me, the images are interesting when they show structure, especially when there is some echo of the original image,” Brill notes. Finding the interesting ones without having to check each of the thousands of possibilities, however, can be tricky and time-consuming.
Brill has tried out a variety of grid-scrambling transformations to see what happens. Aesthetic sensibilities govern which transformation to use, what size the rectangular grid should be, and which iteration to look at, he says. “Once a fruitful transformation, rectangle size, and iteration number have been found, the artist is in a position to create compelling imagery.”
The choice of starting pattern and color scheme can also strongly influence the appeal of the various gridscapes that arise. “Color is a particularly interesting problem,” Brill says. When pixels of different color appear side by side, especially when the combination occurs repeatedly over a region large enough to be visible to the eye, the eye averages them to generate a new color–an effect familiar to pointillist painter Georges Seurat (1859–1891) and other artists.
In computer graphics, this visual effect is known as dithering. “With Poincaré recurrence, the dithering is done entirely by the transformation,” Brill says. “You might think that the results would be muddy, but not so, if one selects colors with an eye toward their mixing potential and does not choose too many.”
“The transformations are not random,” he adds. “The dance of the pixels is quite orderly, so then is the appearance of new colors.”
Brill envisions using his algorithms for fabric design–perhaps for drapes and bedspreads though probably not at present for ties, where the Regis Philbin monocolor look is the latest fashion craze.
“There are worlds of order and beauty lying dormant in our various mathematical systems that these simple algorithmic processes are able to make visible,” Brill concludes. “Mathematics, more than any other human activity, seems to offer connections to the underlying order of the world. This is a great inspiration for an artist and a great challenge.”


