Ups and downs in the quest for clean air

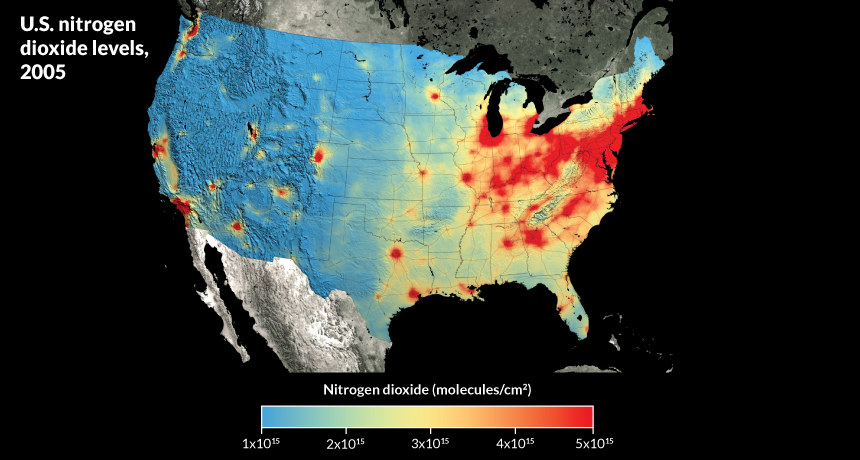
BREATHING EASIER Newly released maps reveal that U.S. air quality has markedly improved over the last decade.
NASA Goddard Scientific Visualization Studio
Newly released maps reveal that U.S. air quality has markedly improved over the last decade. The evidence comes from measurements of nitrogen dioxide (NO2 ), a pollutant emitted by vehicles and coal power plants. Yet as the United States cleans up, rapidly industrializing cities in Asia, the Middle East and Africa are spewing more and more of the yellow-brown gas.
NO2 may not have the notoriety of carbon monoxide or lead, but it causes respiratory problems and combines with other pollutants to form ground-level ozone, a major part of smog. “You wouldn’t get unhealthy levels of ozone in cities without nitrogen dioxide,” says Bryan Duncan, an atmospheric scientist at NASA’s Goddard Space Flight Center in Greenbelt, Md.
Science News headlines, in your inbox
Headlines and summaries of the latest Science News articles, delivered to your email inbox every Thursday.
Thank you for signing up!
There was a problem signing you up.
The maps, based on data from NASA’s Aura satellite, show a clear decrease in NO2 nationwide from 2005 to 2011. Duncan attributes much of the change to curbing power plant emissions, spurred by a 2005 Environmental Protection Agency policy that protects states downwind of major polluters.
However, the promising air quality trend doesn’t extend to the developing world. Beijing headlines a host of Chinese cities with steadily rising NO2 emissions, joined by cities in emerging markets such as India, Bangladesh, Pakistan, Iran and Nigeria.


