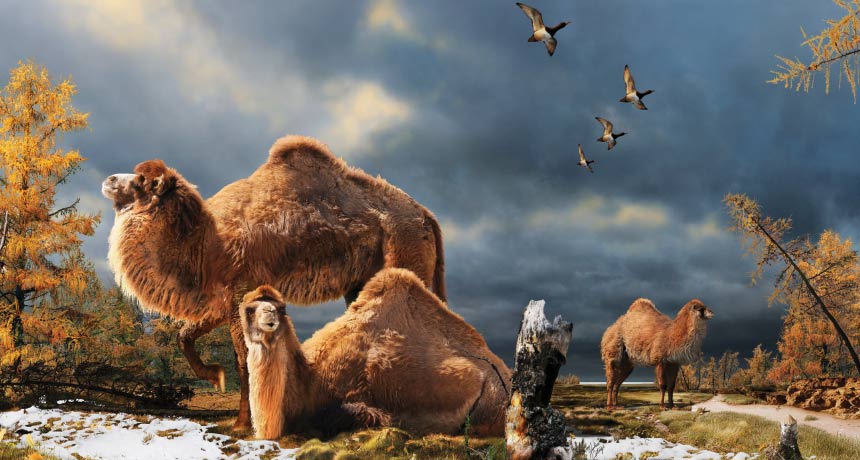
BLAST FROM THE PAST Three million years ago, Earth’s climate was so warm that the High Arctic supported forests (illustrated) in which camels and other animals roamed.
Julius T. Csotonyi
Imagine a world where the polar ice sheets are melting, sea level is rising and the atmosphere is stuffed with about 400 parts per million of carbon dioxide. Sound familiar? It should. We’re living it. But the description also matches Earth a little over 3 million years ago, in the middle of the geologic epoch known as the Pliocene.
To understand how our planet might respond as global temperatures rise, scientists are looking to warm periods of the past. These include the steamy worlds of the Cretaceous Period, such as around 90 million years ago, and the boundary of the Paleocene and Eocene epochs, about 56 million years ago.
But to many researchers, the best reference for today’s warming is the more recent Pliocene, which lasted from 5.3 million to 2.6 million years ago. The mid-Pliocene was the last time atmospheric CO2 levels were similar to today’s, trapping heat and raising global temperatures to above the levels Earth is experiencing now.
New research is illuminating how the planet responded to Pliocene warmth. One set of scientists has fanned out across the Arctic, gathering geologic clues to how temperatures there may have been as much as 19 degrees Celsius higher than today. The warmth allowed trees to spread far to the north, creating Arctic forests where three-toed horses, giant camels and other animals roamed. When lightning struck, wildfires roared across the landscape, spewing soot into the air and altering the region’s climate.
Other researchers are pushing the frontiers of climate modeling, simulating how the oceans, atmosphere and land responded as Pliocene temperatures soared. One new study shows how the warmth may have triggered huge changes in ocean circulation, setting up an enormous overturning current in the Pacific Ocean, similar to the “conveyor belt” in today’s Atlantic that drives weather and climate. A second new paper suggests that the Greenland and Antarctic ice sheets might have responded differently to Pliocene heat, melting at different times.
All this research into the last great warm period is helping scientists think more deeply about how the future might play out. It may not be a road map to the next 100 years, but the Pliocene is a rough guide to the high sea levels, vanishing ice and altered weather patterns that might arrive hundreds to thousands of years from now.
“It’s a case study for understanding how warm climates function,” says Heather Ford, a paleoceanographer at the University of Cambridge. “It’s our closest analog for future climate change.”
Walk through history
Teasing out the history of the Pliocene is a little like digging through a family’s past. One group of enthusiasts goes through genealogical records, collecting data on who lived where, and when. Another group uses computer software and modeling to look for broad patterns that describe how the family grew and moved over time.
The data detectives begin their work in rocks and sediments dating to the Pliocene that are scattered around the world like family-tree histories in city library archives. In 1988, the U.S. Geological Survey began a project called PRISM, for Pliocene Research, Interpretation and Synoptic Mapping, which aims to gather as many geologic clues as possible about Pliocene environments.
Story continues below image
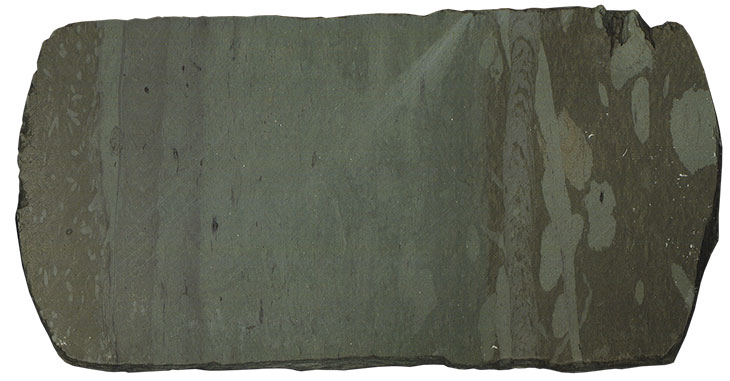
At its start, PRISM focused on a collection of deep-sea cores drilled from the floor of the North Atlantic Ocean. Different types of marine organisms thrive in water of different temperatures. By comparing the relative abundance of species of tiny organisms preserved in the deep-sea cores, PRISM scientists could roughly map how cold-loving organisms gave way to warm ones (and vice versa) at different times in the past. Early results from the project, reported in 1992 by USGS research geologist Harry Dowsett and colleagues, showed that during the Pliocene, warming was amplified at higher latitudes in the North Atlantic.
Scientists continue to add to the PRISM records. One international team drilled a sediment core from beneath a Siberian lake and found that summer air temperatures there, in the mid-Pliocene, were as high as 15° C (about 59° Fahrenheit). That’s 8 degrees warmer than today (SN: 6/15/13, p. 13). Other researchers uncovered clues, such as plant fossils from peat bogs, that suggest mean annual temperatures on Canada’s now-frozen Ellesmere Island near Greenland were as much as 18 degrees higher than today (SN: 4/6/13, p. 9).
Now, a new group of biologists, geoscientists and other experts in past landscapes have banded together in a project called PoLAR-FIT, for Pliocene Landscape and Arctic Remains — Frozen in Time. The team is focusing on the Arctic because, just as today’s Arctic is warming faster than other parts of the planet, the Pliocene Arctic warmed more than the rest of the globe. “That’s what we call polar amplification,” says Tamara Fletcher, a team member and paleoecologist at the University of Montana in Missoula. “It was even more magnified in the Pliocene than what we’re seeing today.”
PoLAR-FIT scientists travel to the Arctic to collect geologic evidence about how the region responded to rising temperatures in the Pliocene. In the thawing permafrost slopes of Ellesmere Island, for instance, Fletcher and colleagues have been mapping black layers of charcoal in sediments dating from the Pliocene. Each charcoal layer represents a fire that burned through the ancient forest. By tracking the events across Ellesmere and other nearby islands, Fletcher’s team discovered that fire was widespread across what is now the Canadian Arctic.
Story continues below image
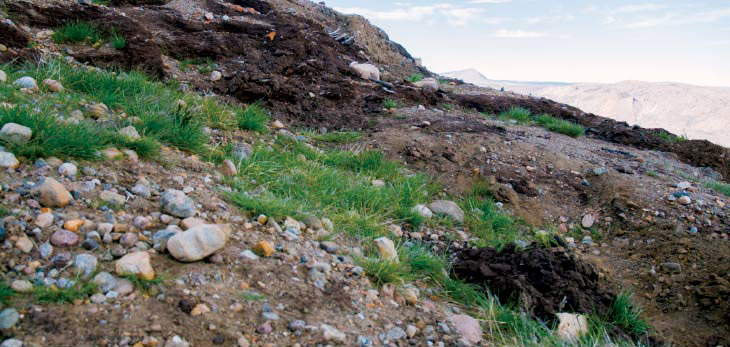
Wildfires changed vegetation across the landscape, possibly altering how the Arctic responded to rising temperatures. Soot rising from the fires would have darkened the skies, potentially leading to local or regional weather changes. “How important is that to the warming?” asks Bette Otto-Bliesner, a paleoclimatologist at the National Center for Atmospheric Research in Boulder, Colo. “That’s something we’re still trying to determine.” Fletcher, Otto-Bliesner and colleagues described the charcoal discovery, along with modeling studies of the fires’ effects, in Seattle in October at a meeting of the Geological Society of America.
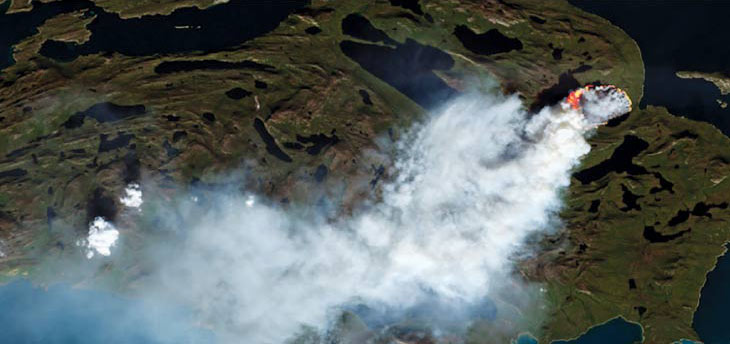
In 2012, about 283,280 square kilometers of forest burned in Russia. Three years later, more than 20,230 square kilometers burned in Alaska. Last summer, a wildfire broke out in the icy landscape of western Greenland. “We’re already seeing fire in the Arctic, which is unusual today,” Fletcher says. “But it wouldn’t have been unusual in the Pliocene.”
While the work doesn’t predict how much of the Arctic will burn as temperatures rise, the findings do suggest that people need to prepare for more fires in the future.
Story continues below image
Trapped ocean heat
Scientists like Fletcher are the genealogists of the Pliocene, collecting records of past environments. Other researchers — the computer modelers — put those old records into broad context, like historians analyzing family trees for patterns of migration and change.
The modelers begin with data on Pliocene temperatures — such as how hot it got on Ellesmere Island or in the North Atlantic Ocean, as revealed by plant fossils or seafloor sediments. Scientists can also estimate how much CO2 was in the atmosphere at the time by looking at clues such as the density of holes in fossilized leaves of Pliocene plants, which used those openings to take up CO2. Estimates vary, but most suggest CO2 levels were about 350 to 450 ppm in the mid-Pliocene.

The Pliocene isn’t a perfect crystal ball for today. For starters, scientists know why CO2 levels are now increasing — burning of fossil fuels and other human activities (SN: 5/30/15, p. 15). As the Industrial Revolution was gaining steam, in the 19th century, atmospheric CO2 levels were around 280 ppm. Today that level is just above 400 ppm, and rising.
Modeling the Pliocene climate can help reveal how Earth responded in somewhat similar conditions. That means studying changes in the Pliocene atmosphere, the land surface and most of all the oceans, which absorb the bulk of planetary warming. “That’s the sort of thing you can understand from studying past warm episodes,” Ford says. “What was different about how heat and carbon were moving around in the ocean?”
Ford has begun working with climatologist Natalie Burls of George Mason University in Fairfax, Va., to try to track how the oceans’ major water masses shifted during the Pliocene. Today the North Atlantic has a deep, cold, salty layer that is crucial to the ocean’s “conveyor belt” circulation. In this pattern, warm waters flow northward from the tropics, then cool and become saltier and denser as they reach higher latitudes. That cool water sinks and travels southward, where it warms and rises and begins the cycle all over again.
This conveyor belt circulation is important to today’s Atlantic climate, because it allows the warm Gulf Stream to moderate temperatures from the U.S. East Coast to Western Europe. Burls and colleagues have now found that a similar pattern might have existed in the Pacific during the Pliocene. They call it the Pacific meridional overturning circulation, or PMOC, just as today’s similar Atlantic circulation is known as the AMOC.
Burls’ team discovered this phenomenon by modeling how the Pliocene ocean would have responded to higher temperatures. Because the Arctic was so warm, the temperature difference between the equator and the mid- and high latitudes was not as great as it is today. The weaker temperature gradient would have meant less rainfall and more evaporation in the midlatitude North Pacific. As a result, its uppermost waters would have gotten saltier.
When the North Pacific waters got salty enough, they cooled and sank, setting up an enormous current that dove deep off the coast of northeastern Russia and traveled southward until the water warmed enough to once again rise toward the surface. Real-world data back the claim: Accumulations of calcium carbonate in deep-sea Pacific sediments show that the Pliocene ocean experienced huge shifts at the time, with waters churning all the way from the surface down to about three kilometers deep, as would be expected from a conveyor belt–type circulation. The team reported the finding in Science Advances in September.
What happened in the Pliocene Pacific may say something about the Pacific of the distant future, Burls says. As temperatures rise today, most of the heat is being taken up by the surface layers of the oceans. Over the short term, that works to prevent changes in deep ocean circulation. “Today we’re very quickly turning on the heating, and it will take a while for the deep ocean to adjust,” Burls says.
But in the longer term, thousands of years from now, waters in the North Pacific may eventually become warm and salty enough to establish a PMOC, just as there was in the Pliocene. And that could lead to major changes in weather and climate patterns around the globe.
Land bridges and ice sheets
Other modelers are looking beyond the Pacific to improve their understanding of how different parts of the Pliocene world behaved. About a dozen research groups recently launched a new effort called PlioMIP2, or Pliocene Model Intercomparison Project, Phase 2, to model the climate of a time somewhat similar to today in the mid-Pliocene, about 3.205 million years ago.
“We’re working to produce the best picture that we can of what life seemed to be like at the time,” says Alan Haywood, a climate modeler at the University of Leeds in England and a leader of the effort.
In one discovery, project scientists have found that small changes in the geography of their modeled world make a big improvement in the final results. Early models did not accurately capture how much the polar regions heated up. So PlioMIP2 researchers updated their starting conditions. Instead of assuming that the landmasses of the Pliocene world were identical to today, the group made two small, plausible changes in the Arctic. The researchers made a land bridge between Russia and Alaska by closing the Bering Strait, and they added land to connect a few modern islands in the Canadian Arctic, including Ellesmere.
The change “seems small, but it actually can have a huge impact on climate,” says Otto-Bliesner. For instance, closing the Bering Strait cut off a flow in which relatively fresh water from the Pacific travels over the Arctic and into the North Atlantic. With the updated geography, the PlioMIP2 models suddenly did a much better job of simulating heat in the high Arctic.
Otto-Bliesner will describe the team’s results in New Orleans this month at a meeting of the American Geophysical Union. Another PlioMIP2 group, Deepak Chandan and Richard Peltier of the University of Toronto, reported similar findings in July in Climate of the Past. They too found that closing the Bering Strait allowed their model to better simulate the Arctic heating.
Other Pliocene modelers are trying to figure out how the planet’s enormous ice sheets in Greenland and Antarctica might respond to rising temperatures. Geologic evidence, such as ancient beaches from the Pliocene, suggest that global sea levels then were as much as 25 meters higher than today. If all of Greenland’s ice were to melt, global sea levels would rise about six meters; if all of Antarctica went, it would contribute about 60 meters. So parts of these ice sheets, but not all, must have melted during the long-ago warm period.
Several of the PlioMIP2 research groups are modeling how the polar ice sheets responded in the heat of the Pliocene. “It will tell us how much we should be worried,” Otto-Bliesner says.
Story continues below graphic
One new study suggests that the northern and southern ice sheets may have behaved out of phase with each other. In a simulation of the mid- to late Pliocene, climate modeler Bas de Boer of Utrecht University in the Netherlands and colleagues found that as Greenland’s ice melted, Antarctica’s ice could have been relatively stable, and vice versa.
“At different points, they could be contributing to the sea level story or against it,” says Haywood. He, along with colleagues, reported the results in the Oct. 30 Geophysical Research Letters.
That out-of-sync melting suggests the Pliocene was a complicated time. Just because global temperatures were high doesn’t mean that all of Earth’s ice sheets melted equally. (Today, both Greenland and West Antarctica are losing ice to the oceans as global temperatures rise.)
The Pliocene wound to an end around 2.6 million years ago, as CO2 levels dropped. Chemical reactions with eroding rocks may have sucked much of the CO2 out of the atmosphere and tucked it away in the oceans, removing the greenhouse gas. The planet entered a long-term cooling trend. Since the end of the Pliocene, Earth has been in and out of a series of ice ages.
But now, greenhouse gases are once again flooding into the atmosphere. Global temperatures are ticking up inexorably year after year. That makes the lessons of the past all the more relevant for the future.
This article appears in the December 9, 2017 issue of Science News with the headline, “Lessons from the Pliocene: A warm period in the past offers a window to the future.”


