Getting from here to there by air can be a frustrating experience. Equipment failures, bad weather, even low clouds can set off a chain reaction of flight delays and cancellations at busy airports. The effects of problems at one airport can readily end up affecting airports across the country and around the world. At times, the international air transport system seems poised on the brink of failure.
Indirectly, the same system also plays a role in the transmission of deadly diseases, such as influenza and, most recently, Severe Acute Respiratory Syndrome (SARS), which passengers can unwittingly carry to new locations before getting ill themselves. Indeed, air travel played an important role in the spread of SARS in March 2003.
Now, Luis Amaral of Northwestern University in Evanston, Ill., and his coworkers have used various mathematical tools to characterize the structure of the worldwide air transportation network and help identify critical points or weak links in the system. They report their findings in the in the May 31 Proceedings of the National Academy of Sciences.
“Just as one cannot fully understand the complex dynamics of ecosystems by looking at simple food chains or the complex behavior in cells by studying isolated biochemical pathways, one cannot fully understand the dynamics of the air transportation system without a ‘holistic’ perspective,” the researchers contend. “Modern ‘network analysis’ provides an ideal framework within which to pursue such a study.”
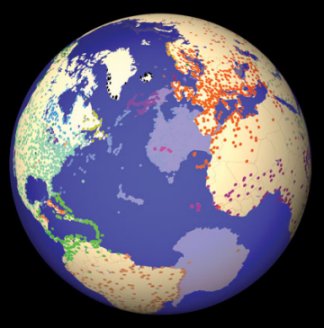
Amaral and his coworkers analyzed air traffic data for one week in November 2000. The data encompassed more than 500,000 flights between 27,000 pairs of cities worldwide. These links involved more than 800 airlines and 3,883 cities and other locales that have one or more airports with scheduled flights.
The researchers found that the air transport network falls into the same category as other interconnected systems, such as the Internet, in which a few major hubs have many connections and most other nodes have only a few connections. Such a strongly unbalanced system is known as a scale-free, small-world network.
In calculating the average minimum number of flights needed to get from any city to any other city in the world, Amaral and his colleagues discovered that, for all 3,663 cities in the worldwide network, it takes an average of 4.4 flights to travel between any two of these places. For a closely connected subsection of the network that links 719 cities in Asia and the Middle East, the average number is just 3.5 flights.
The most difficult route is getting from Mount Pleasant in the Falkland Islands to Wasu, Papua New Guinea (or vice versa). Such a journey would require 15 separate flights.
It also seems that the busiest hubs, such as Chicago’s O’Hare, aren’t necessarily the most critical for ensuring that the entire system functions smoothly (or that disease outbreaks are thwarted). Certain airports prove to be important gateways, particularly when they serve as conduits between international routes and other, local airports.
In such a model, for example, Pars and Frankfurt have comparable levels of air traffic, but Paris has more connections to different cities. So, Paris is more important for maintaining the world’s airline network connections.
Indeed, Paris ranks at the top of the list of the 25 “most connected” cites. It also tops the list of the “most central” cities in the air transportation system. The “most central” designation is characterized by “betweenness.” The betweenness of a given city is defined as the number of shortest paths connecting any two cities that involve a transfer at the given city.
“Surprisingly, the nodes with more connections are not always the most central in the network,” the researchers note. Despite having relatively few connections, for example, both Anchorage and Port Moresby, Papua New Guinea rank high in the centrality list because they serve as important gateways.
You can view the “connectedness” rankings at http://amaral.northwestern.edu/Press/Guimera-2005-PNAS/table-connectivity.html and the “centrality” rankings at http://amaral.northwestern.edu/Press/Guimera-2005-PNAS/table-centrality.html.
Based on patterns of interconnectivity, the researchers also established the existence of several communities—subparts of the international network—that have particularly close ties.
This “allows us to identify the most efficient ways to engineer the structure of the network,” Amaral and his coworkers suggest. “One can identify which [communities] are poorly connected and the ways to minimize that problem.”
Moreover, they add, cities that connect different communities play a disproportionate role in the propagation of infections such as SARS.