An oceanographer buys a piece of whale flesh at a market in Japan. The clerk assures her the meat comes from a Baird’s beaked whale, which is legal to hunt under certain circumstances. The scientist takes the meat to her lab, performs a DNA analysis of it, and finds that it is in fact an endangered right whale. Killing a right whale is a crime.
When the oceanographer reports her findings to the International Whaling Commission, the commissioners ask her one question: how certain are you?
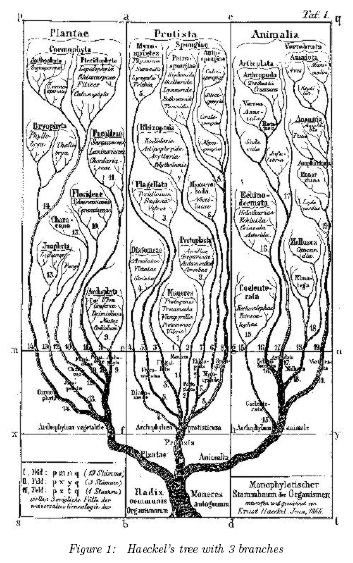
Until recently, a scientist would not have been able to give a rigorous answer. The analysis depends on the scientist’s understanding of the evolutionary relationships among different species of whales, and statisticians didn’t know how to analyze the tree-shaped graphs that express those relationships.
Now, mathematicians have developed a new understanding of the mathematics of tree-shaped graphs, which makes possible the statistical analysis of evolutionary trees. The development will help biologists to make sense of the flood of newly available genetic information.
Evolutionary trees are critical for an oceanographer studying whale meat, because scientists have not yet decoded the genomes for every species of whale. Trees can provide the additional information about evolutionary relationships that researchers need in order to figure out, with enough certainty, which species of whale a piece of meat has come from.
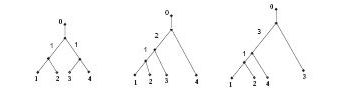
Thus, for the hypothetical oceanographer in Japan to quantify how certain she is that the whale meat comes from a right whale, she needs to assess the accuracy of the evolutionary tree that she used in her analysis. Because different pieces of data suggest slightly different evolutionary trees, it can be difficult to determine precisely what tree is correct. If the various possible trees resemble one another, the chosen tree is likely to be close to the actual pattern of descent. If the possible trees vary widely, the tree she chooses might be quite unlike the actual evolutionary tree.
To assess the certainty of their conclusions, biologists need a way to quantify the degree to which two or more trees are similar. Because this challenge requires analyzing the shapes of tree graphs, biologists have turned to mathematicians for help. Only recently have mathematicians developed the necessary tools to analyze such shapes.
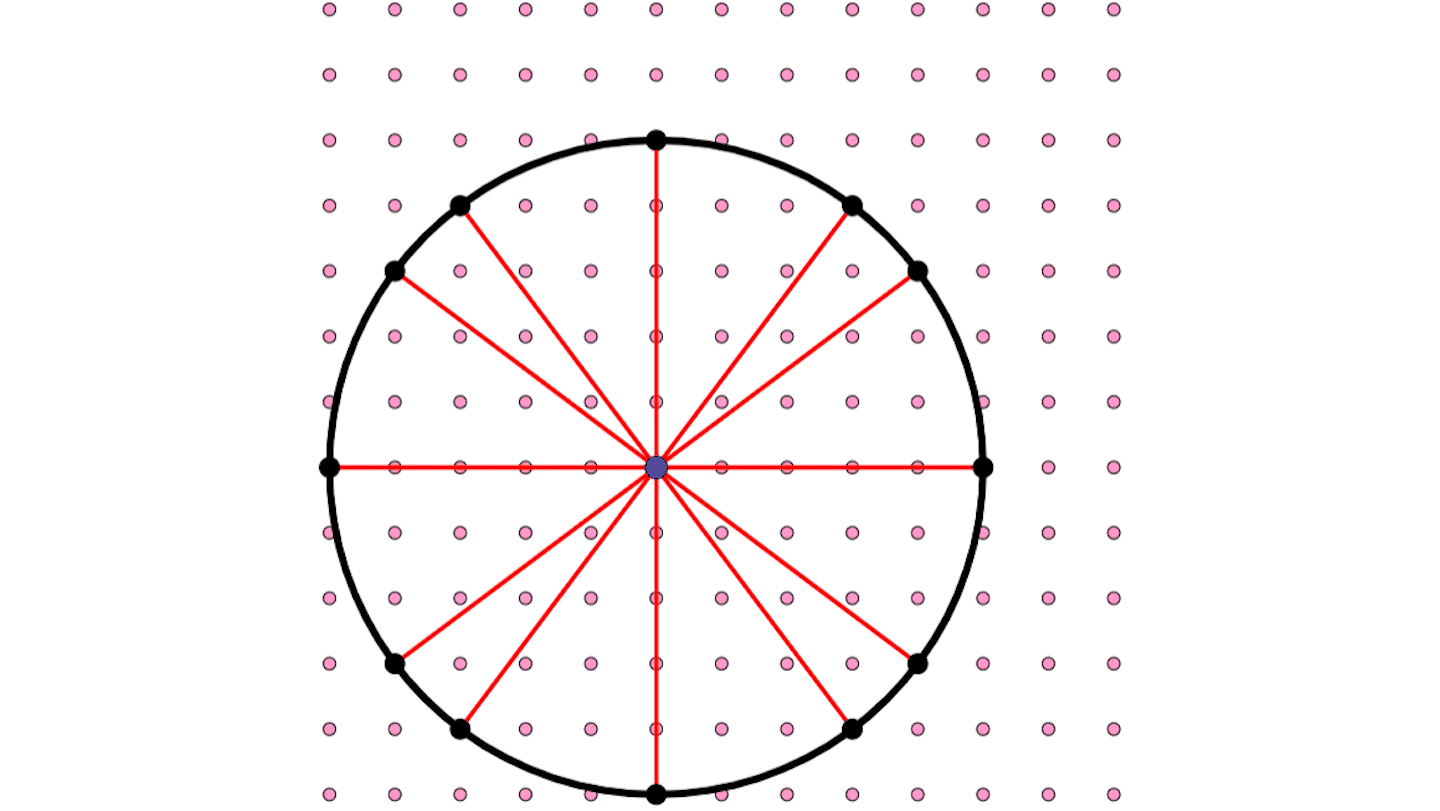
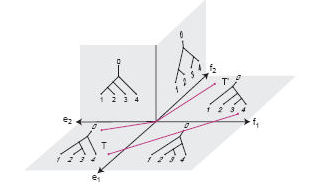
Susan Holmes, a statistician at Stanford University, and mathematicians Louis Billera and Karen Vogtmann of Cornell University in Ithaca, N.Y., have found a way to quantify the difference between two trees, effectively determining the distance between them. They used this distance function to construct a “space” of trees, a sort of theoretical forest.
In relatively small areas, this space looks like ordinary space of two, three, or more dimensions, depending on how many nodes are in the tree. But the mathematicians found that the overall space forms a shape like a saddle. In mathematical terms, the space has negative curvature.
In the surface of any three-dimensional space with negative curvature, there is only one shortest line connecting any two points. Had the space been positively curved, it would resemble the surface of a ball. On a ball, there is more than one shortest line connecting two points. For example, the shortest distance between the Earth’s North Pole and the South Pole is traversed by any of the great circles.
The existence of only one shortest line connecting any two points is the key property that allows the mathematicians to compute an “average tree” at the center of a clump of estimates. The confidence of the estimate is then related to the distance from the average tree to each of the estimates. On positively curved surfaces, a single average point might not exist at all, which would make it impossible to pin down the confidence level.
The researchers have used their new methods to develop a freely available statistical software package that augments a statistics program called R. The software was first released two years ago. “Biologists are using it quite a lot,” Holmes says. One of Billera’s graduate students, Megan Owen, is developing more efficient algorithms to calculate the shortest path between a pair of points.
“What this tells me is that you don’t know what kind of mathematics is going to be useful to biology,” Billera says. “It wasn’t clear before this that geometry and topology would be useful to biology. Who would think they had anything to do with each other?”
If you would like to comment on this article, please see the blog version.