A visit to the supermarket can present a shopper with a bewildering array of choices. For ice cream alone, the consumer faces a variety of brands, flavors, container sizes, and types (fat-free versus low-fat versus premium, and so on).


At the same time, deciding which items to stock is a formidable problem for retailers. They have a limited amount of shelf space, yet the number of different products in a particular category can be overwhelming. Moreover, they must cope with constantly changing consumer tastes and increasingly rapid turnover in the products available. One survey of five stores, for example, reported the introduction of 129 ice-cream products and the removal of 118 items from this category during a recent 2-year period.
To decide which items to sell, retailers could track sales and focus on the most profitable items. Such a strategy, however, can’t keep pace with consumer whims and product turnover. They could also carry all available items in a given category, but most retailers don’t have the necessary shelf space. Moreover, surveys suggest that stocking more products may actually confuse customers.
A better strategy would be to replace some products with others that are more profitable for the retailer. Hence, it would be useful for retailers to have a framework that would allow them to evaluate alternative assortments of items in the light of consumer perceptions and preferences, then to select the most profitable one.
Business professors Christopher S. Tang of the University of California, Los Angeles, Teck-Hua Ho of the University of Pennsylvania, and Juin-Kuan Chong of the National University of Singapore have now developed tools for making such decisions. They describe their approach in the current issue of Manufacturing and Service Operations Management.
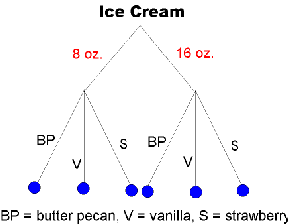
In the framework developed by Tang and his collaborators, a product category is represented by a “tree,” where each level of branches (and nodes) corresponds to a different product attribute. For example, ice cream can be differentiated first according to container size and then according to flavor. The example (right) shows a category product tree for ice cream that has six nodes, corresponding to two sizes (8 oz. and 16 oz.) and three flavors (butter pecan, vanilla, and strawberry).
The researchers quantified the relative importance of a node to a consumer by using survey data on purchase frequency. For instance, suppose a consumer purchased ice cream on 30 visits to the supermarket, getting 8 oz. vanilla 15 times. The corresponding node’s importance (or weight) would be 15/30, or 0.5.
They also introduced parameters they described as “brand width measures,” which quantify the attraction of a particular brand to a consumer on a visit to the supermarket and take into account whether a certain brand of an item corresponding to a node is available for sale.
These measures are based on the structure of the product trees for different brands. In effect, they capture the degree of similarity (or disparity) among products within a brand and across different brands in the same category. Two brands that offer exactly the same selection of products would have identical trees.
In developing a modeling framework that incorporates brand width measures, the researchers assumed that a customer adopts a two-step decision process: He or she decides whether to buy a product from a particular category, and, if the decision is positive, chooses a specific brand. The decision can depend on such factors as stock at home and on the attractiveness of the store inventory in terms of preferred choice, price, and so on.
Hence, the probability that a consumer purchases a certain brand on a given trip to the supermarket is simply the probability that a consumer buys a product from a particular category multiplied by the conditional probability that a certain brand is chosen when a purchase is made.
The equation for brand choice probabilities incorporates such factors as perceived utility and loyalty, along with brand width measures. Another equation provides purchase probabilities. When calibrated using data from purchase records and shopping trips, the equations can be used to identify which product substitutions would lead to higher profits and to quantify lost sales from poor category management.
In a test of their modeling framework, Tang and his colleagues used shopping information from 548 households gathered over a 2-year period to examine purchases of ice cream, frozen pizza, regular cereal, spaghetti sauce, yogurt, coffee, hot dogs, and potato chips). In evaluating different assortments in each category, they discovered that relatively small changes in product assortment could boost profits by as much as 25 per cent.
“The number of replacements in reconfiguration exercises ranges from 2 to 32 with an average replacement per brand of less than 1,” the researchers reported.
Interestingly, in the case of assortment changes in ice cream, coffee, hot dogs, and potato chips, unit sales were lower but profits higher because sales shifted to higher-margin brands. For the other four categories, higher profits resulted from an increase in unit sales.
“We believe our model can be a useful planning tool for making important product assortment decisions at a retail store,” Tang and his colleagues concluded.
The model developed by Tang and his coworkers is just one of many current efforts aimed at helping retailers cope with a highly competitive and volatile marketplace. Another such avenue is the use of data-mining techniques, applied to electronic sales data now readily available to most retailers, to assess how sales of one product influence those of another in a different category and, hence, affect total profitability.
Ice cream with chocolate syrup, anyone?


