A new map is the best view yet of how fast Antarctica is shedding ice
The research could help improve projections of sea level rise
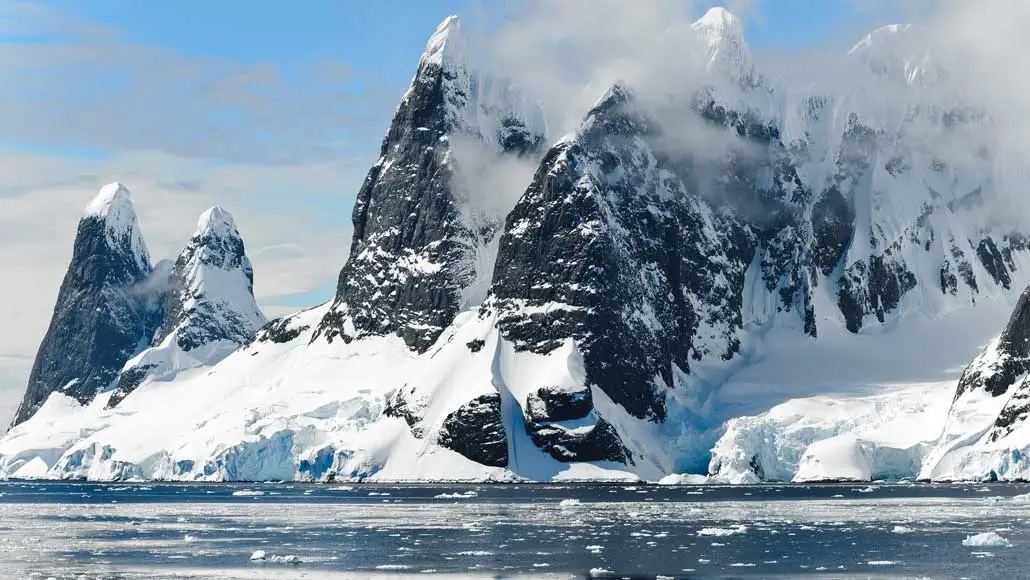
ICE ICE BABY Glaciologists used observations from a cohort of satellite missions over decades to create the most detailed map yet of ice flow across Antarctica.
Αναστασία Πορτνά/Wikimedia Commons (CC BY-SA 4.0)
Decades of satellite observations have now provided the most detailed view yet of how Antarctica continually sheds ice accumulated from snowfall into the ocean.
The new map is based on an ice-tracking technique that is 10 times as precise as methods used for previous Antarctic surveys, researchers report online July 29 in Geophysical Research Letters. That offered the first comprehensive view of how ice moves across all of Antarctica, including slow-moving ice in the middle of the continent rather than just rapidly melting ice at the coasts.
Charting Antarctic ice flow so exactly could reveal the topography of the ground underneath, as well as improve forecasts for how much ice Antarctica stands to lose to the ocean in the future. Ice melting off the continent is already known to be a driver of global sea level rise (SN: 7/7/18, p. 6).
Glaciologists at the University of California, Irvine, uncovered subtle movements of Antarctic ice with a kind of measurement called synthetic-aperture radar interferometric phase data. By using a satellite to bounce radar signals off a patch of ice, researchers can determine how quickly that ice is moving toward or away from the satellite. Combining observations of the same spot from different angles reveals the speed and direction of the ice’s motion along the ground.
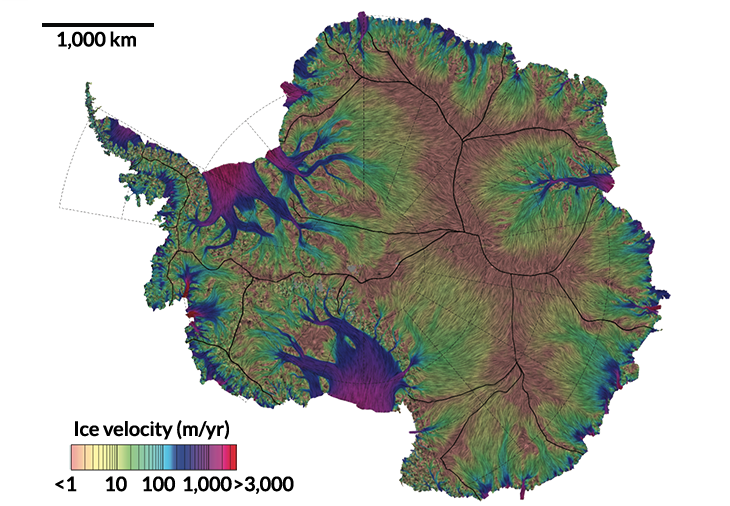
Covering ground
A new map based on satellite radar data reveals the velocity of ice flow across Antarctica from areas of high elevation (thick black lines) to the coasts. Inland ice moves incredibly slowly — much of it plods along at fewer than 10 meters per year. Closer to the ocean, ice can travel hundreds to thousands of meters per year.
Velocity of ice flowing across Antarctica varies by location
To get multiple vantage points of the same swathes of ice, researchers had to cobble together data from about half a dozen satellites launched by Canada, Europe and Japan since the early 1990s. “Each brought a little piece of the puzzle,” says study coauthor Eric Rignot.
The resulting map reveals how ice flows from points of high elevation, known as basin boundaries toward the coast. For 80 percent of Antarctica, the map shows average ice velocity down to about 20 centimeters per year. That’s a major upgrade from previous maps, which relied on ice-tracking techniques with uncertainties of a few meters per year.
In 2021, NASA and the Indian Space Research Organization plan to launch a satellite that will gather enough data to update this map every few months — allowing scientists to better monitor how ice flow across Antarctica changes as the climate changes.