State of U.S. Agro-ecosystems
About one-quarter of the United States’ land cover, excluding Alaska, is farmed–some 430 million to 500 million acres. A massive new project has just assessed this and other food-producing environments, such as coastal waters, fresh waters, and rangelands, to tally factors contributing to health. Released on Sept. 24, it indicates that most ecosystems are undergoing change–some declining dramatically while others improve.
In 1995, the White House Office of Science and Technology Policy commissioned the H. John Heinz Center for Science, Economics and the Environment to launch a nonpartisan, scientifically grounded assessment of environmental conditions in the United States. The Heinz Center focused its efforts on identifying indicators of the health of the nation’s living resources, together with the land- and waterscapes in which they reside.
For this new assessment, which cost nearly $4 million, the Center drew upon experts in the government, the private sector, universities, and environmental-research organizations–in all, more than 150 people. Two-thirds of the funding came from Uncle Sam, the rest from 13 private corporations and foundations.
A 270-page, encyclopedic document resulted.
Rather than diagnosing one element as sick and another as healthy, it lists features of each ecosystem–measures of fitness or potentially adverse symptoms–and lets the reader come to his or her own conclusions about overall well-being. However, to aid individuals in making a determination, the new report offers mini-analyses of each measured feature–such as the amount of carbon stored in grasslands–under the heading: “What is this indicator and why is it important?” The report also evaluates how complete the data were about that feature and points to major information gaps that could compromise the reliability of assessment.
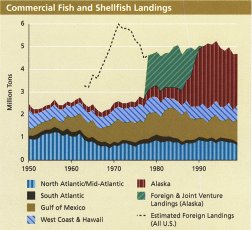
For instance, the new report finds that among fish stocks for which the number of animals is known, 40 percent of the populations have declined over the past 2 decades, and 20 percent have increased. But the study offers an important caveat: “Population trends are not known for three-quarters of commercially important stocks.” Similarly, while the total catch of fish from U.S. waters has remained stable in recent years (see table), such cumulative totals don’t highlight the extent to which this reflects working harder (i.e., spending more time at sea per ton hauled in) or accepting catches of less desirable species–such as dogfish (shark) instead of Atlantic cod.
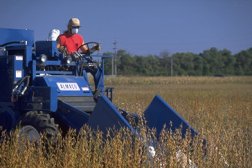
In contrast, exceptionally good and detailed data exist for field crops– where they were produced, what it took to grow them, how yields have changed, and what their market value is. Such information shows that just five plants–corn, wheat, soy, hay, and cotton–account for 90 percent of harvested acreage and more than half of all crop income. Although the acreage planted annually has declined slightly since 1950, per-acre yield increases for the top crops during that period more then compensated.
Most of the per-acre yields for these five crops roughly doubled over the past half-century, and corn yields nearly quadrupled. However, the report also points out, these increases “have not translated into steadily increasing farm [income].” The gross value of agricultural production–that’s money a farmer receives, not the price a consumer pays–totaled $180 billion in 1999, only about 10 percent more, after adjusting for inflation, than a half-century earlier.
Even in these cropland assessments, the new report finds that certain important types of data are missing, such as the share of lands that have developed elevated salt concentrations, which are potentially poisonous to plants; the share of wildlife–such as ducks, newts, and butterflies–typically cohabiting farmlands; and the biological health of soils as measured by a soil-nematode index, in which the variety of those roundworms indicates a soil’s capability to nurture potentially beneficial microscopic animals.
Three years ago, the U.S. Geological Survey issued its own assessment of the nation’s living environment. That two-volume report ran 1,000 pages. The new study defines ecosystems more broadly, says Robin O’Malley of the Heinz Center, a primary author of the new report. Rather than just focusing on the dwellers of ecosystems, “we include the chemical dimensions–such as water quality, nutrients, and contaminants–as well as physical ones, such as erosion.” The new assessment also measures services and goods, such as food, that people derive from these ecosystems.
But perhaps the biggest difference in the two reports, O’Malley says, is that the earlier one tended to make the best use of available data, whatever those might be. If data on a particularly, influential indicator didn’t exist, the subject was largely skipped over. In contrast, the new study attempts to identify the features that stand to best capture the health of a particular environment, and then to graph data about this indicator–provided they exist–both nationally and over time.
On the land. . .
Plant agriculture continues to dominate in the Midwest. The new report finds that 75 percent of the farmed land there is devoted to field crops. Elsewhere throughout the United States, the value falls closer to 50 or 60 percent, with less intensively managed lands for livestock comprising much of the remainder.
For all its productivity, farmed acreage can be a serious source of pollution.
For instance, the new survey finds that 10 percent of tested streams and 20 percent of groundwater wells in rural areas exceed federal drinking water standards for nitrate. Most of this nitrate is presumed to come from nitrogen-based fertilizers or rainwater runoff of livestock manure. Not only can high concentrations of nitrate poison people, but they also fuel the development of harmful algal blooms in lakes and estuaries. Some 75 percent of sampled farm-area streams also showed phosphorous, another crop fertilizer, at concentrations that exceeded the federally recommended ceiling to prevent excessive algal growth. There wasn’t sufficient data to establish trends over time for these pollutants.
Crop pesticides wash off the fields with rains, and the new survey reports, “All [farm-area] streams had at least one pesticide at detectable levels throughout the year, and 75 percent had an average of five or more.” More importantly, 83 percent of streams sampled in farm areas contain at least one pesticide at concentrations exceeding federal guidelines for protecting wildlife.
More encouraging: Efforts to curb soil erosion appear to be working.
During the last 2 decades, U.S. farmers have increasingly retired much of their most erodible land under programs such as the Conservation Reserve Program and left crop stubble on the fields after harvest to stabilize soils. According to the new report, the farm acreage with high potential for wind erosion has been cut by nearly one-third–to 63 million acres. The farmland highly susceptible to water erosion has seen a similar percentage decrease–to 89 million acres.
Big unknowns
The new report offers a huge, graph-heavy portrait of trends regarding the U.S. environment. But the most complete data–and therefore the strongest trends–describe features that were already pretty well known and understood.
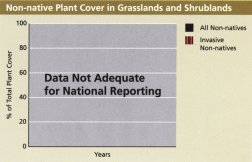
Some intriguing and important environmental indicators are those for which data proved scantiest. For instance, the survey could not quantify the number and impacts of newly arriving nonnative species nor which ecosystems seem to encounter these alien invaders most frequently.
For other indicators, such as the extent of coastal wetlands–home to shellfish and the nurseries of many marine fish–only some regional data existed. The new report found wetland acreage along the Atlantic and Gulf coasts has declined by 8 percent during the past 50 years. However, information on coastal wetlands elsewhere, or for sea grasses, shellfish beds, and coral reefs anywhere, proved too paltry to determine trends.
The same regional limitations hampered national assessments of coastal pollution. People can pick up toxic chemicals by eating tainted fish or other foods from the sea. Roughly 60 percent of the bottom sediments in estuaries and coastal ocean waters in the Mid-Atlantic to Gulf Coast contain contaminants that might harm fish or other wildlife, the new survey finds. Indeed, it notes, concentrations of those chemicals in an estimated 2 percent of the sediments “probably will harm these organisms.” However, the report adds that “neither trend data nor data on other regions are available.”
Details on most ecological indicators for fresh-water systems and grass/shrub lands are similarly spotty, defying assessments of even broad regional trends. In all, the report found inadequate data for aspects of an intended indicator depicted in 31 graphs, and insufficient data to graph anything for another 47 indicators.
If biologists and policymakers are concerned about the data gaps, they now have a catalog that maps where they are and explains why filling these data gaps might pay big dividends.
In fact, O’Malley says, “our target audience is people who make decisions that affect the environment and those people who want to influence them.” It’s his hope that “we’ve been able to provide these people with a set of facts that we can all agree on”–data that will serve as the basis of future policy.
The new assessment’s organizing team expects to update details on important aspects of ecosystem health in a new report every 5 years. New indicators may be added at these times, O’Malley says, because our understanding of major ecosystem features and processes has been evolving steadily.
He notes, for instance, “25 or 30 years ago, we would not have had a nonnative species indicator in every one of our ecosystems.” They’re there today. “I don’t know what the catalog of indicators will be 30 years from now,” he told Science News Online, “but I have to imagine that new things will emerge that, similarly, we can no longer ignore.”