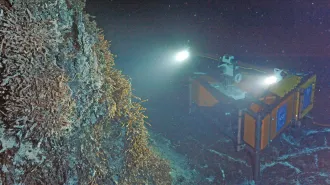
Last Nov. 16, at 8:43 p.m., a magnitude-7.5 earthquake struck deep beneath the ocean near Alaska’s Little Sitkin Island, far out in the Aleutian Islands. Within 25 minutes, National Oceanographic and Atmospheric Administration (NOAA) scientists issued a tsunami warning for U.S. Pacific coastal areas. Forty minutes later, a pressure sensor on the seafloor hundreds of kilometers south of Alaska detected the tsunami’s vanguard pulses. Data from that instrument—one of six in a network activated just the previous month—indicated that the wave was only 2 centimeters tall there. Simulations previously run on computers suggested that such a wave wouldn’t be a danger to Hawaii or other distant shores, and NOAA canceled its tsunami warning less than 90 minutes after the quake occurred.
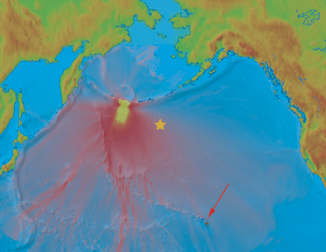
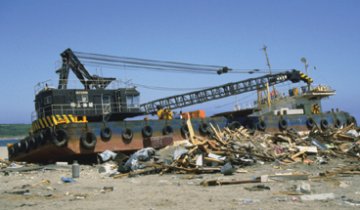
A few hours later, the tsunami swept into the harbor in Hilo, Hawaii, and raised water levels there about 21 cm, just 2 cm higher than predicted by the simulations. No damage was done.
This successful prediction paid off big for U.S. taxpayers, says Eddie N. Bernard of NOAA’s Pacific Marine and Environmental Laboratory in Seattle. He estimates that the canceled tsunami warning saved, in Hawaii alone, at least $68 million—the economic impact of a statewide coastal evacuation. In comparison, the six seafloor sensors in the Pacific network—three south of the Aleutians, two off the U.S. West Coast, and one along the equator between Chile and Hawaii—are part of a tsunami-hazard mitigation effort that has cost only $17.6 million since the program’s inception in 1997.
Other parts of the program include assessing tsunami risk for coastal communities. Geophysicists are using digital models of topography and detailed simulations of fluid flow to estimate which parts of population centers are at most risk from the potentially deadly waves. Some geologists are scouring coastal landscapes to find traces of prehistoric tsunamis, and other scientists are analyzing more-recent records from tidal gauges to see whether they reveal a pattern in how often tsunamis of varying sizes strike particular locations.
Waves ahoy
Taken from Japanese, the word tsunami typically stimulates thoughts of monstrously tall waves that wipe out coastal communities and kill thousands of people. But tsunamis come in all sizes. Scientists estimate that the death toll of the 141 damaging tsunamis that occurred during the 20th century exceeds 70,000. During the same period, however, at least 900 smaller tsunamis caused no damage whatsoever. Some, just centimeters high when they hit shore, sloshed right past swimmers and were detected only by instruments.
Distinguishing small tsunamis from the large ones before they strike is a matter of life and death, as well as of money. Accurate tsunami simulations, such as the one that NOAA scientists used to cancel last November’s tsunami warning, hold promise for greatly reducing the number of unnecessary evacuations across the Pacific, says Bernard. False alarms cost more than money, he adds, because they erode public confidence in the agencies that broadcast the warnings. That, in turn, could lead people to remain in coastal areas despite accurate warnings.
At the fall meeting of the American Geophysical Union in San Francisco last December, Bernard described the National Tsunami Hazard Mitigation Program—a partnership that includes representatives from four federal agencies and the five states that border the Pacific Ocean. He told Science News that he’d like to see the program’s network of tsunami-detecting instruments expand from 6 to around 20 sensors, a number that would permit their spacing at about 400 km apart along the West Coast and the section of Alaska deemed most at risk from tsunamis.
A critical part of the mitigation program identifies coastal communities at risk and maps which parts of them would be inundated by a tsunami. About 3 million people are at risk in 512 U.S. cities and towns, says Bernard. So far, maps have been generated for 125 communities that are home to about 1.3 million of those residents.
Maps can show tsunami-flood areas in several ways. In the past, such maps have been simple and typically focused on how far inland a large tsunami might reach. Some maps also included information about how fast the flow of water might be over land or how long the inundation might last. Today, says Philip Watts of Applied Fluids Engineering in Long Beach, Calif., powerful computer simulations enable analysts to calculate many different parameters related to a tsunami strike and to display them in a variety of ways.
For example, he and his colleagues can create detailed digital models of coastal topography and then swamp the area with a cyber-tsunami. In addition to identifying land areas that will become inundated, the simulations can characterize the flows scouring those areas. Well-designed graphic displays can instantly highlight areas where water flow would be strong enough to knock down a person, wash away an automobile, break a ship’s anchor, or move objects or debris. All these parameters can help scientists and public-safety officials assess tsunami hazards, says Watts.
The same simulations can estimate when a tsunami would arrive, when maximum flooding would occur, and when the waters would recede. These factors would be of prime interest to emergency-response personnel, says Watts. Those responders would like to know where to place their equipment and personnel so that they’re out of a tsunami’s reach. They’d also need to know when a tsunami’s finally spent and it’s safe to move from high ground. The simulations could indicate which routes in and around the tsunami zone might be free of flood debris.
More data, please
Scientists developing tsunami-risk maps can—and probably should—use other data to supplement computer simulations, says Lori A. Dengler, a geophysicist at Humboldt State University in Arcata, Calif. The maps that she and her colleagues are developing for coastal Humboldt County in northern California incorporate tsunami-relevant information from the local geological record.
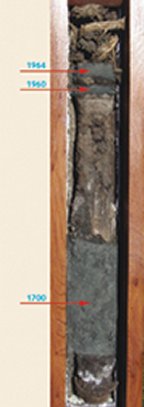
For example, a marsh just south of Crescent City, Calif., contains a layer of sand about 8.5 millimeters thick. That material was washed inland in 1960 by a tsunami that was generated by a strong earthquake off the coast of Chile. A more recent sheet of sand about 1.7 cm thick chronicles a 1964 tsunami that killed 11 people in Crescent City. Thick sand layers deeper in the sediments denote earlier tsunamis.
One of those strata, due to a tsunami that swept through the region in 1700, is 15 cm thick, about nine times as thick as that of the killer wave of 1964, Dengler notes. Results of several investigations have suggested that a massive earthquake just off the coast of the Pacific Northwest on Jan. 28, 1700, wreaked geological havoc throughout the region (SN: 11/29/97, p. 348) and spawned a tsunami that affected ports in Japan and probably elsewhere on that side of the Pacific. At another California marsh nearby, a layer of sand thicker than the one deposited in 1700 marks an even more monstrous tsunami that occurred about 2,500 years ago.
Analyses of data garnered from modern tidal gauges at some sites in Japan suggest that carefully tracking the pattern of small tsunamis can be useful for determining risk for particular tsunami-prone locations. For 10 communities along Japan’s Pacific coast, instruments detected at least 10 tsunamis over several decades, says Stephen M. Burroughs, a geophysicist at Florida’s University of Tampa. There was a broad range of peak heights of individual tsunamis at each site, with the largest wave for each location topping out at least 10 times the height of the smallest.
For each of the sites, smaller tsunamis occurred more frequently than bigger ones, following an equation called a power-law distribution, says Burroughs. Scientists have discovered that the sizes and frequencies of many natural phenomena, such as wildfires and earthquakes, show power-law relationships (SN: 2/2/02, p. 75: Available to subscribers at It’s a Rough World).
At Miyako, on Japan’s northeast coast, the power-law relationship based on tide-gauge data gathered between 1958 and 1996 suggests that 4-m-high tsunamis should occur there, on average, once each 63 years. Tsunamis about 7 m tall should strike less frequently, about once every century. Over the past 141 years, people have recorded three tsunamis that measured at least 4 m high and one that reached elevations of at least 7 m—rates that are consistent with the ones estimated from smaller waves, says Burroughs.
In Tosa-Shimizu, in southwestern Japan, the power-law relationship—developed using data on small waves obtained between 1931 and 1995—suggests that a tsunami measuring 20 m tall might hit the port once every 229 years, on average. One such monster wave did strike the site in 1707, Burroughs notes.
Unreliable sources
What these analyses based on on-shore measurements can’t reveal is the source of past tsunamis or what phenomena will cause future ones. Up to 95 percent of tsunamis are caused by earthquakes, and the vast majority of those waves are just a few centimeters tall, says Steven N. Ward of the University of California, Santa Cruz. Other phenomena that produce tsunamis less frequently may give rise to the monster waves that can be much larger and more devastating than their earthquake-triggered counterparts.
Consider tsunamis that are caused by underwater landslides. While some of these slumps are small or slow, in others, mountain-size volumes of sediments shoot down undersea slopes at speeds exceeding 100 kilometers per hour. An undersea slide that occurred shortly after a major earthquake near Papua New Guinea in July 1998 created a tsunami that wrecked a 20-km stretch of coastline. Along those beaches, the tsunami was as much as 15 m tall (SN: 8/14/99, p. 100: http://www.sciencenews.org/pages/sn_arc99/8_14_99/fob2.htm).
One factor that makes undersea landslides dangerous is that they, unlike earthquakes, don’t seem to have an upper limit on their magnitude, says Ward. Scientists estimate that about 4 cubic kilometers of sediment moved during the Papua New Guinea slide—an amount of material that could fill about 1,100 New Orleans Superdomes but nonetheless is small on the geological scale. Imagine the power of the largest known submarine landslide, which occurred off the coast of Norway about 8,000 years ago and moved 8,500 cubic km of material.
Some of the largest tsunamis, however, may be created by heavenly visitors. After all, comets, asteroids, and meteorites that reach our planet’s surface have a 70 percent chance of hitting an ocean. Ward and his colleague Steven R. Chesley of NASA’s Jet Propulsion Laboratory in Pasadena, Calif., have estimated that tsunamis generated by extraterrestrial impacts occur, on average, every 5,200 years. Small objects create most of these impacts, which usually have only modest effects. On the other hand, the researchers estimate that a space rock 300 m across could generate a tsunami about 11 m high and inundate areas as far as 1 km inland.
Scientists may have discovered the impact site of one big space rock that smacked into the South Pacific just a few hundred years ago. In eastern Australia, researchers have found jumbled deposits of rocks more than 130 m above sea level that they propose were left by a tsunami. That debris has been dated to about A.D. 1500—a date that matches when the Maori people inexplicably moved away from some areas of New Zealand’s coast, says Stephen F. Pekar, a sedimentologist at Queens College in New York. On New Zealand’s Stewart Island, two sites sport possible tsunami deposits at elevations of 150 m and 220 m, respectively.
The source locations and heights of waves that could have lofted materials to those elevations steered the search for the impact’s ground zero to beneath the sea southwest of New Zealand, says Pekar. Sure enough, he and his colleagues have discovered a crater there that’s about 20 km wide and about 150 m deep. Samples of sediment taken from the seafloor southeast of the crater, but not those obtained elsewhere around the crater, contain small mineral globules called tektites, one hallmark of an extraterrestrial impact. That pattern suggests that an object may have struck from the northwest—a path that would have taken the blazing bolide over southeastern Australia, where aboriginal legends mention just such a fireball.
The rock that created tsunamis off New Zealand 500 years ago may have been around 1 km across, the researchers say. Ward and his colleagues previously estimated that a 1-km-wide asteroid slamming into the Atlantic Ocean about 600 km off North Carolina could send 130-m-tall tsunamis over beaches from Cape Hatteras to Cape Cod within 2 hours. In 8 hours, tsunamis between 30 and 50 m tall would scour European coasts.
More frequent but possibly less damaging sources for megatsunamis include volcanic islands, which can collapse after eruptions deplete their internal magma reservoirs. Also, the flanks of such islands can catastrophically slide to the ocean floor after centuries of weathering has weakened them. Such events, which can spawn tsunamis more than 100 m tall, occur somewhere in the world every 10,000 years or so, says Ward.

