Your photos reveal more than where you went on vacation

Mining pictures posted to online photo-sharing sites is revealing how tourists and residents explore their surroundings and how those environments change through time. The Brooklyn Bridge is one of the most photographed sites in New York City, a recent analysis found.
look@j/Flickr (CC BY-NC-SA 2.0)
Summer is upon us and that means clichéd vacation photos are nigh. But that picture of your cousin holding up the leaning tower of Pisa or of Fred from accounting jumping in front of [insert national monument here] could be a data point in a bigger picture. Scientists are tapping into the vast repositories of photo sharing sites like Flickr and Picasa to investigate scenarios that typically unfold over months or years, such as how tourists explore a city or the changing of a skyline or glacier through time.
Computer scientists from Google and the University of Washington have developed a method for stitching together photos that yields stunning time-lapse sequences of sites from around the world. The researchers, who will present the work at the 2015 SIGGRAPH meeting in August, mined some 86 million photos uploaded to the Google sites Picasa and Panoramio and sorted them using geo-location tags and timestamps. The team then aligned the photos and used various algorithms to warp the images to a common viewpoint and smooth over variations in appearance (including removing your cousin or Fred from the shot).
The constructed videos allow the viewer to witness the growth of the Goldman Sachs Tower in Manhattan, the shrinking of the Briksdalsbreen Glacier in Norway and even the slight shift in the position of Wall Street’s charging bull.
|
Computer scientists used vacation photos to create time-lapse sequences of changing landscapes that include the interior of museums and shifting sandbars in Thailand. Ricardo Martin Brualla/YouTube |
The effort is computationally taxing; it takes several hours to compile, align and clean up the photos. But using this passively collected data takes far less time than setting up a camera in a potentially remote location and then waiting, waiting and waiting for the data to accumulate. If people were encouraged to send pics of far-flung places to a particular server, the approach could help track changes in remote, access-limited locations, the researchers propose.
Similarly, other scientists are using photo datasets to explore patterns in human behavior, research that previously would take months or years of expensive surveys and field studies.
“We are living in a very interesting age,” says Stanislav Sobolevsky, a research scientist at MIT’s SENSEable City Laboratory. “We can measure things using a single global dataset that would have taken years to examine in the past.”
Sobolevsky should know; along with colleagues from MIT and the University of Calabria in Italy, he is using photos uploaded to Flickr to examine how people experience cities. The researchers gathered roughly 70 million photos taken between 2007 and 2010. Then, for a given photographer and a given location, they looked at the duration of time over which the photos were taken to roughly determine where the person who snapped the shots lived (resident, a domestic tourist or a foreign tourist). Then the scientists ranked the top 10 most popular cities (San Francisco came out on top, Berlin in 10th place) and explored who was doing what where.
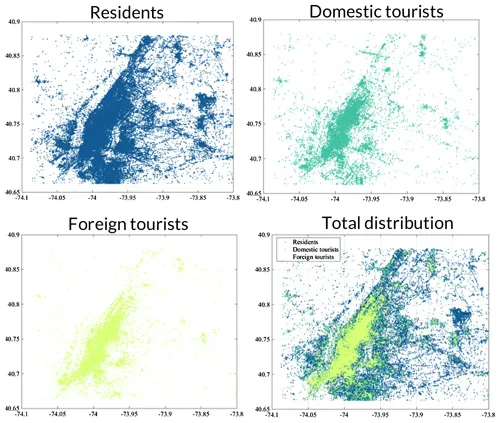
While the research is preliminary, it aligns well with other work by Sobolevsky and colleagues that examined human travel patterns using Twitter and credit card transactions. Such research might be used to help city planners make infrastructure decisions, such as where to put a new subway stop, or inform an entrepreneur who wants to open a new restaurant, Sobolevsky told me.
For another look at where people are posing (and if you pride yourself on visiting out-of-the-way places), check out Sightsmap, a heat map of photographed spots overlaid on Google Maps. Then snap and upload those pics. If a scientist gets their hands on them, your photos may end up revealing more than you think.