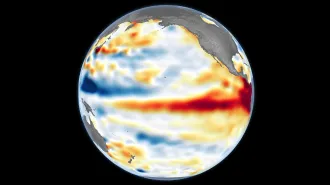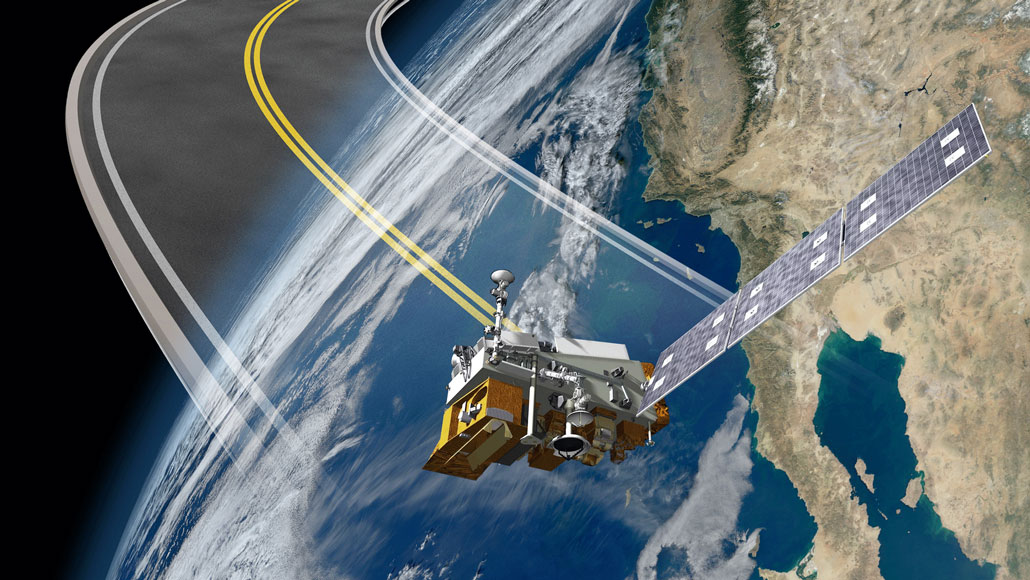
Satellites, such as the Joint Polar Satellite System-1 spacecraft illustrated here, track changes on land, in oceans and in the atmosphere. Scientists use these data to verify how well climate models are reproducing real-world conditions.
NOAA Satellites
Earth’s climatic future is uncertain, but the world needs to prepare for change.
Enter climate simulations, which re-create the physical interactions between land, sea and sky using well-known physical laws and equations. Such models can look into the past and reconstruct ancient ice ages or hothouse worlds with the help of data gleaned from rocks and ice cores.
But climate scientists also use these simulations to envision a range of different possible futures, particularly in response to climate-altering greenhouse gas emissions. These Choose Your Own Adventure–type scenarios aim to predict what’s to come as a result of different emissions levels over the next few decades. That means putting upper and lower boundaries on answers to questions such as: How hot will it get? How high will the seas rise?
The good news is that climate simulations are getting better at re-creating even the subtlest aspects of climate change, such as the complicated physics of clouds, the impact of aerosols and the capacity for the ocean to absorb heat from the atmosphere.
But there’s also bad news: More information doesn’t always mean more clarity. And that is now feeding into uncertainty about just how bad the “worst-case scenario” might be for Earth’s climate.
Five years ago, the probable worst-case climate scenarios were worrisome enough. Under a so-called “business-as-usual” scenario, in which humankind takes no action to abate greenhouse gas emissions, by 2100 the planet was projected to warm between 2.6 degrees and 4.8 degrees Celsius relative to the average Earth temperature from 1986 to 2005 (SN: 4/13/14). Global mean sea level was thought likely to increase by up to a meter in that same scenario, according to the 2014 report by the Intergovernmental Panel on Climate Change, or IPCC.
But the newest generation of climate models suggests Earth’s climate may be even more sensitive to very high levels of atmospheric carbon dioxide than once thought. And that, in turn, is increasing projections of just how hot it could get.
“We’re having discussions of ‘Do we believe these models?’” says Andrew Gettelman, a climate scientist with the National Center for Atmospheric Research, or NCAR, in Boulder, Colo.
That’s because the simulations use the same equations to look at past and future climate conditions. And many simulations still struggle to re-create accurately the climate of very warm time periods in the past, such as the Eocene Epoch (SN: 11/3/15). As the world gets hotter, it turns out, the uncertainties start to ramp up. “Nobody is arguing about whether [the temperature increase will be] less than 2 degrees,” Gettelman says. “We’re arguing about the high end.”
Turning up the heat
The first whiff that something very strange was going on with the latest models came in March, at a meeting in Barcelona of scientists and modelers working on next-gen climate simulations. Many of the simulations are destined to be incorporated into the next IPCC assessment report, the first part of which is scheduled for release in April 2021.
All of the simulations include estimates of something called equilibrium climate sensitivity, or ECS. That basically means how Earth’s future climate is expected to respond to a new normal — specifically, an atmosphere that contains twice as much carbon dioxide as during preindustrial times.
A similar trend is shown by several well-known simulations, developed by teams at NCAR, the U.S. Department of Energy, England’s Hadley Centre for Climate Prediction and Research in Exeter and the Paris-based Institut Pierre Simon Laplace, or IPSL. In those models, the ECS was higher, meaning the Earth was more sensitive to carbon dioxide, than in previous model generations. If real, that suggests that the gases can exert even more influence on Earth’s atmosphere than thought. Ultimately, that could mean that temperatures could get hotter than even the highest previous projections suggested.
In September, scientists with IPSL and the French National Center for Scientific Research, or CNRS, also in Paris, went public with their simulations. Based on projections from two separate climate models, the teams reported that average global warming by 2100 could climb as high as 6 to 7 degrees C (or about 11 to 13 degrees Fahrenheit) relative to preindustrial times.
Like many new-gen climate simulations, the two French models feature finer-scale resolution and better representations of real-world conditions than past simulations. When tested against present-day climate observations, the new simulations also do a better job of reproducing those observations, says CNRS climatologist Olivier Boucher.
But the high ECS remains a surprise. “Our [model] is better” in terms of the physics, Boucher says. “But it doesn’t automatically translate into having more confidence for the future projections.”
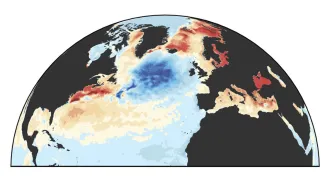
This ECS conundrum, which so many of the models still show, came up again November 21 at a meeting of the National Academy of Sciences atmospheric and climate science board in Washington, D.C. The likeliest cause of the high ECS, Gettelman said at the meeting, was in how much the models estimate that clouds will enhance warming (SN: 3/22/14). Among other factors, how high the clouds are in the atmosphere matters: Lower-altitude clouds can reflect sunlight back into space, while higher-altitude clouds can trap heat. Gettelman and his colleagues also discussed the significance of clouds in ECS modeling in July in Geophysical Research Letters.
“Clouds at high latitudes look like they’re quite important,” Gettelman says. The region over the Southern Ocean is one of particular interest, but there are now studies afoot to examine the effects of high-altitude clouds in the Arctic as well as lower-altitude clouds in the tropics.
A new paradigm
Puzzling out how to discuss the high-ECS models will likely be a headache for the authors of the next IPCC report. The landscape of climate simulations is getting more complicated in other ways as well.
For the 2014 IPCC report, climate modelers also participated in the fifth iteration of a project to set standards and scenarios for climate projections. That project is called the World Climate Research Programme’s Coupled Model Intercomparison Project, or CMIP5 for short.
CMIP5’s future projections were organized using a concept called “representative concentration pathways,” or RCPs. Each pathway outlined a possible climate future based on the physical effects of greenhouse gases, such as carbon dioxide and methane, as they linger in the atmosphere and trap radiation from the sun. An Earth in which greenhouse gas emissions are dramatically and swiftly curbed was represented by a scenario called RCP 2.6. The business-as-usual scenario was known as RCP 8.5.
The IPCC’s upcoming sixth assessment report will rely on projections from CMIP6, the new more sensitive models. And in them, RCPs are out, and a new paradigm called “shared socioeconomic pathways,” or SSPs, is in.

While RCP projections are based solely on how different concentrations of gases warm the atmosphere, SSP projections also incorporate societal shifts, such as changes in demographics, urbanization, economic growth and technological development. By tracking how such changes can affect future climate change, scientists hope that SSPs can also help nations better assess how to meet their own emissions target pledged under the Paris Agreement (SN: 12/12/15).
Data drive
Human behavior isn’t the only source of uncertainty when it comes to envisioning worst-case scenarios. Scientists also are wrestling with simulating the complicated physical interactions of ice and ocean and atmosphere, particularly as temperatures continue to rise.
“Most oceans have air on top of them, and [some] oceans have ice on top of them. And the ice is moving, the ice is interacting. It’s a very difficult thing,” says Richard Alley, a glaciologist at Penn State.
Climate models are just now getting to the point where they can reproduce many of these interactions by “coupling” them together into one simulation, Alley says. Doing so is key to accurately projecting possible futures: Such coupled simulations reveal how these interactions feed into one another, raising the potential for even higher temperatures or even higher seas.
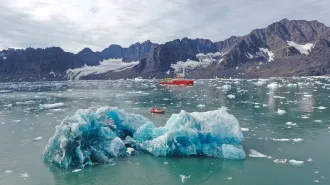
But numerous sources of possible uncertainty remain when it comes to anticipating the so-called worst-case scenario. For example, how fast the seas will rise is linked to how quickly the great ice sheets blanketing Greenland and Antarctica will lose ice to the ocean, through melting or collapse (SN: 9/25/19).
Climate simulations are still not reproducing that melting well, even in the IPCC’s special report on climate change’s impacts on ice and oceans released in October 2019. That’s partly because scientists don’t fully understand how the ice responds to climate change, says glaciologist Eric Rignot of the University of California, Irvine. “We’re making progress,” he says, “but we are not there.”
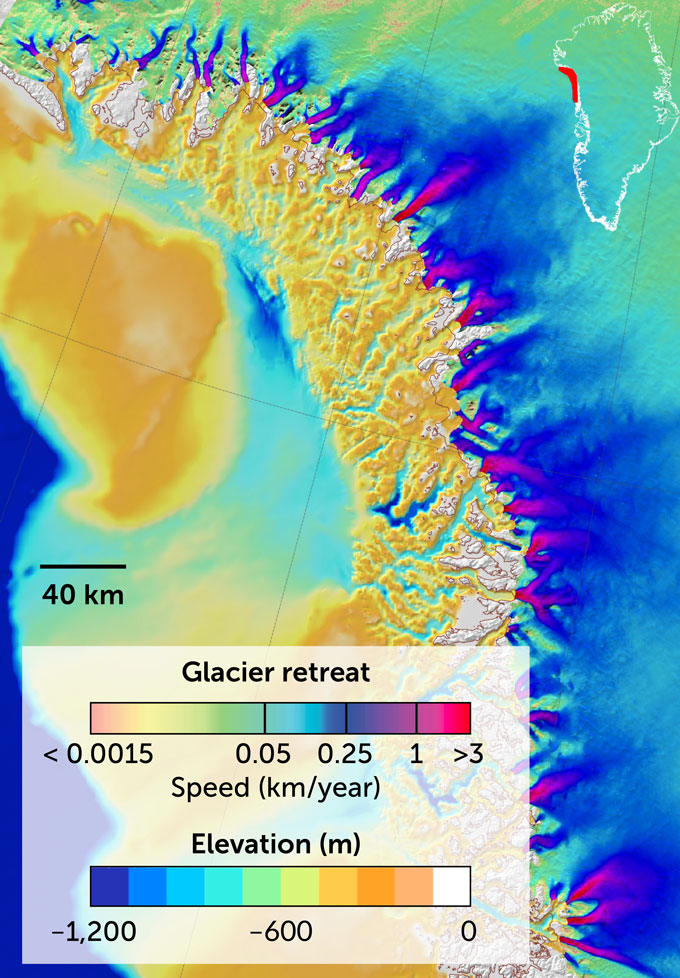
One of the largest uncertainties is how warming oceans can interact with the vast underbellies of glaciers fringing the ice sheets, eroding them, Rignot says. To identify how such erosion might occur requires detailed bathymetry maps, charts of the seafloor that can reveal deep channels that allow warmer ocean water to sneak into fjords and eat away at the glaciers (SN: 4/3/18). He and his colleagues have been creating some of those maps for Greenland.
Scientists also are trying to get boots-on-the-ground data to tackle other uncertainties, such as how warming can change the behavior of the ice sheets themselves as they stretch, bend and slide across the ground. In 2018, an international collaboration of scientists began a five-year project to study the breakup of the Florida-sized Thwaites Glacier in the West Antarctic Ice Sheet in real time. Warm ocean waters are thinning the glacier, which supports the ice sheet like a buttress, slowing the flow of ice toward the ocean. Thwaites is likely to collapse, possibly within the next few decades.
And there are other processes not yet included in the CMIP models that could send ice tumbling rapidly into the sea: Meltwater seeps through cracks and crevasses to the base of the ice sheet, lubricating its slide from land to ocean. Meltwater can also refreeze into solid, impermeable slabs that can speed up the flow of newer meltwater into the ocean (SN: 9/18/19). Perhaps most frighteningly, some researchers have suggested that future warming could cause Antarctica’s giant, steep ice cliffs to suddenly lose large chunks of ice to the ocean, rapidly raising sea levels (SN: 2/6/19).
There’s a good reason why current climate models don’t include the ice cliff hypothesis, Alley says. “The best models, the ones that you can have the most faith that they’re reconstructing what’s happened recently, generally do not spend a lot of effort on breaking things off,” he says. The problem isn’t in simulating the physics of ice bits breaking off, it’s in simulating exactly which ice shelves will break off — and when. That makes the potential error of simulating those processes very large.
“That’s a lot of the tension in the community right now,” Alley adds. “How to deal with this is still proving very difficult.”
The IPCC’s 2019 special report noted the ice cliff hypothesis, but considered it extremely unlikely. But that doesn’t mean it’s impossible, Alley says — or that it hasn’t happened in the past. Evidence from ocean sediments reveals that giant icebergs have broken away from continent-based cliffs and melted out at sea in the past. If Thwaites glacier retreats all the way to Antarctica’s interior, ongoing calving could create massive cliffs twice as high and 10 times as wide as any observed in Greenland, he noted in December at the American Geophysical Union’s annual meeting in San Francisco.
The IPCC is “assuming we’ll get lucky and it won’t happen,” Alley said. But the ocean sediment data raises “really serious questions about that assumption.”
Gettelman, meanwhile, cautions that the lingering uncertainty in future projections does not mean the world should wait to see what happens or for scientists to figure it out. “It really means we need to do something soon,” he says. Whether the high temperature or sea level rise projections turn out to be real or not, “it’s still pretty bad.”