These 6 graphs show that Black scientists are underrepresented at every level

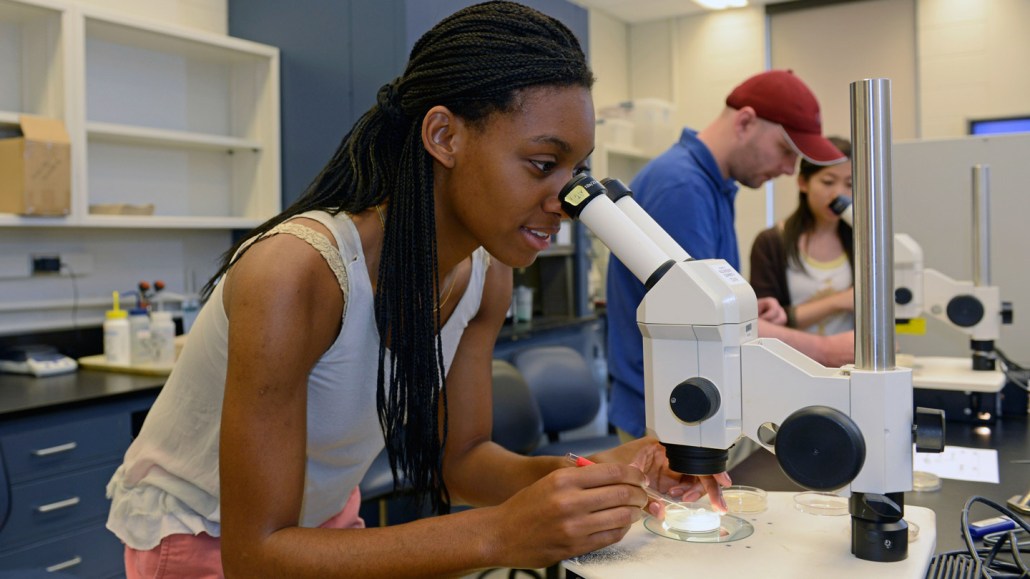
U.S. universities have a lot of catching up to do so that Black STEM students are represented at levels consistent with their representation in the U.S. population. This Cornell student attended a Yale summer program to gain experience in a developmental biology lab.
Michael Doolittle/Alamy Stock Photo
Nationwide protests in response to the police killings of George Floyd, Breonna Taylor and other unarmed Black men and women in the first part of 2020 inspired calls to action within academia’s ivory tower.
Social media movements such as #BlackInSTEM brought attention to discrimination faced by Black students and professionals throughout the science, technology, engineering and mathematics pipelines. U.S. Black residents studying and working in STEM fields are underrepresented at every level, from undergraduate degree programs to the workforce.
The academic environment fails to support Black students, says economist Gary Hoover of the University of Oklahoma in Norman. “Black students in STEM are some of the most talented people around, and if the environment isn’t going to be welcoming, these folks just take their talents elsewhere.”
More U.S. students are getting science and engineering degrees than ever before. But the gap for Black students in these fields has been stubbornly wide, as population-adjusted figures show. In 2018, the most recent year for which data are available, about 238 of every 100,000 U.S. residents earned a STEM bachelor’s degree. If the Black community was adequately represented in STEM higher education, its rate would be similar – 238 of every 100,000 Black residents would have earned these degrees. Yet only 161 of every 100,000 Black residents had done so.
The gap continues into graduate school. In 2018, Black residents were 12.3 percent of the U.S. population, but only 8.4 percent of bachelor’s graduates, 8.3 percent of master’s graduates and 5.5 percent of doctoral graduates.
U.S. Black students in STEM, 2000–2018
From 2000 to 2018, the rising number of Black students in U.S. STEM degree programs mirrored the upward trend of STEM students overall, but the representation gap held firm. Displaying the graduation figures by population makes clear that Black students are earning STEM degrees at lower levels than Black people are represented in the overall U.S. population. If their graduation figures aligned with their population representation, the yellow lines would be right up there with the blue lines.
As Black STEM students make their way up the academic ladder, they may face learning and research environments that are unsupportive or actively hostile. In a 2018-2019 study by the American Institute of Physics, Black students in physics reported that they commonly experienced a lack of financial support, as well as microaggressions, small interactions in which peers or superiors question a person’s presence or performance due to racially charged bias. These experiences negatively affected the person’s sense of belonging in the field. The study results were based on a survey of 232 students, 53 percent of whom identified as Black or Black biracial. In the survey, 42 percent of the Black physics students reported that their department creates a supportive environment “most times,” compared with 53 percent of their white colleagues. Four percent of the Black students reported that their department “never” creates a supportive environment; none of the white students selected this response.
“As I reflect on my own academic journey… there were fewer and fewer Black students in my programs,” says anthropologist Stephanie Poindexter of the University of Buffalo in New York. Poindexter was one of very few Black students studying primates in her undergraduate program, and representation narrowed further as she progressed to a Ph.D. “What I see is a lot of untapped potential,” Poindexter days: “interested students of color who are not fostered into higher degrees in the same way that other students are fostered.”
Within the U.S. STEM workforce, Black scientists are also underrepresented, as are Hispanic or Latino and Native American scientists, according to 2017 data.
Subscribe to Science News
Get great science journalism, from the most trusted source, delivered to your doorstep.
U.S. STEM employment by race and ethnicity, 2017
In 2017, Black residents, Hispanic or Latino residents and Native Americans and Alaskan Natives were severely underrepresented among U.S. scientists, engineers and health care professionals, when compared with the overall populations for these identities.
Among 11 STEM professions reviewed by the National Center for Science and Engineering Statistics, or NCSES, only one field demonstrates a rate of Black representation that is close to the overall population: 92 of every 100,000 Black residents are social scientists, compared with 122 of every 100,000 U.S. residents overall.
STEM employment for U.S. Black residents by field, 2017
All major STEM fields in the United States have Black representation rates (yellow bars) far below the overall rates of U.S. working professionals (blue).
The disparity is especially severe in engineering. For example, 29 of every 100,000 U.S. residents are chemical engineers compared with 2 of every 100,000 Black residents.
“Young Black potential engineers have few role models that look like them and/or come from similar backgrounds that they can emulate, manifesting in a deficit in the younger students cultivating these skills,” says Aaron Kyle, senior lecturer in biomedical engineering design at Columbia University’s Fu Foundation School of Engineering and Applied Science. Kyle also notes that minority scientists may be cited less than their peers, leading to challenges in career advancement.
Engineering employment for U.S. Black residents, 2017
Among U.S. engineers (blue bars), Black representation (yellow) is lowest in chemical engineering. If Black professionals were represented equally, the yellow and blue bars would be the same length.
Disparities in salary are found in most, but not all, STEM fields. Computer science has the largest disparity, with a median annual salary in 2017 of $97,000 for white professionals compared with $72,000 for Black professionals. There are so few working Black mathematicians that the NCSES couldn’t even make a comparison.
Black scientists in the biological and social sciences, on the other hand, have higher median salaries than their white colleagues. Perhaps, Hoover says, some social sciences, such as political science, may be “more readily able and willing to embrace issues around ethnicity, race and inclusion” than other fields, allowing Black scientists to negotiate more equitable pay.
Median STEM salaries by field for Black scientists, 2017
Once employed, U.S. Black STEM graduates tend to be paid less than colleagues from other racial backgrounds, according to 2017 data. The biological and social sciences are an exception.
When Black students shift to other tracks, Black communities suffer from a lack of doctors, researchers and engineers who directly understand their experiences and needs. The loss leads to blind spots in innovation, Kyle says.
“We see clear examples of this, ranging from facial recognition software not accurately identifying Black faces all the way through race-based health care disparities: COVID-19 mortality, elevated maternal [death] in Black women, higher amputation levels amongst Black diabetics,” he says. For instance, the mortality rate for Black newborns was cut in half when the babies were cared for by Black doctors, according to a recent report in the Proceedings of the National Academy of Sciences (SN: 8/25/20).
To improve Black representation in science, Poindexter, Hoover and Kyle all say that solutions must include new offerings of grants, promotions and other research programs dedicated to supporting Black STEM students from elementary school into the workforce. “There needs to be a concentrated effort and financial commitment to balance the scales in the next one to five years,” Poindexter says.
Methodology
All data are sourced from the National Science Foundation’s National Center for Science and Engineering Statistics (NCSES). Data in “U.S. Black students in STEM, 2000–2018”come from the Integrated Postsecondary Education Data System, an annual survey conducted by the National Center for Education Statistics. IPEDS changed its definition of a doctoral degree in 2008: prior to 2008, our doctoral degree numbers reflect the sum of IPEDS’ “Doctor’s degree (old degree classification)” and “First-professional degree (old degree classification)” figures. Graduation numbers for students identifying as Black and total students are compared against overall U.S. population data, sourced from the Census’ American Community Survey 1-year estimates from 2010 to 2018 and from the Census Bureau’s National Intercensal Tables from 2000 to 2009. The science and engineering fields represented in that graph include: Agriculture, Natural Resources and Conservation, Computer and Information Systems, Engineering, Biological and Biomedical Sciences, Mathematics and Statistics, Psychology and Health Professions. Both survey data and Census data include all U.S. residents (citizens and non-citizens).
Data in “U.S. STEM employment by race and ethnicity” and “STEM employment for U.S. Black residents”come from the NCSES’ most recent Women, Minorities and Persons with Disabilities in Science and Engineering report, released in 2019. Employment data are found in the charts labeled “Median annual salary of scientists and engineers employed full time,” and are as of 2017. Employment numbers for working STEM professionals, both overall and identifying in different race and ethnicity categories, are compared against overall U.S. population data, sourced from the Census’ American Community Survey 1-year estimates for 2017. Salary data are from in the charts labeled “Median annual salary of scientists and engineers employed full time,” and are as of 2017. These data are weighted estimates based on surveys of 61.2 million individuals under age 76 who have a bachelor’s or higher degree and are living in the United States. Figures for this story focused on data describing those who have a science and engineering or related degree and/or occupation.