What does fake news look like to you?
 Journalists work hard to communicate science to the public, and we use more than words to do it. Visuals are vital tools in our journalistic kit, whether it’s a graphic explaining the relationship between two datasets, as in the bar chart on how people share fake news on social media, or the cover image of a wad of bills that clearly says “money.”
I find the conversations we have about how to best illustrate a story endlessly enthralling, and one of the great pleasures of my job. For a feature story, those conversations start weeks, even months, before the story goes to press. A whole bunch of people cram into design director Erin Otwell’s tiny office: the writer, features editor Cori Vanchieri, assistant art directors Chang Won Chang and Tracee Tibbitts, chief design officer Stephen Egts, digital director Kate Travis, associate digital editor Helen Thompson and yours truly. Much discussion ensues, whether it’s over how best to convey symmetry in the laws of physics (a series of simple illustrations) or how the brain clears out waste while we sleep (a diagram of the flow of cerebrospinal fluid).
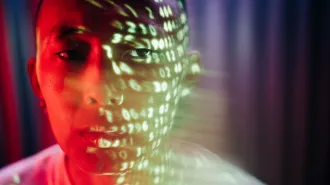
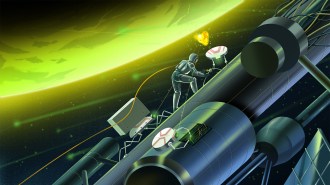
The biggest challenges come in explaining a concept; they’re also, to my mind, the most rewarding. With this issue’s feature by technology writer Maria Temming, the debate continued for days. The article explains why it’s hard to tell disinformation from fact on the internet, and how computer scientists are building algorithms to try to make that easier. How would you sum up that notion in a single image? Lying could be Pinocchio, sure, but then how do you convey the news part? And what about the detecting? A magnifying glass; a bloodhound? Illustrator Alex Nabaum e-mailed a series of sketches testing different concepts, all of them fascinating. We’d reply; Nabaum would draw; another series of sketches would pop up in the inbox.
In the end, we decided that his sketch of a polygraph machine with the needles scratching out our headline best fit the concept of the story.
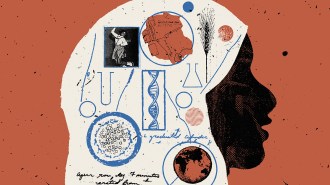
Many artists share my obsession with science. In mid-July, I was fortunate enough to give the opening plenary speech at the 50th anniversary conference of the Guild of Natural Science Illustrators, a national association. Members’ visualizations range from the design of the James Webb Space Telescope to the biochemical processes inside a brain to the odd structure of a flamingo’s beak. All of this work embraces an essential conundrum of science communication — being accurate while being clear.
Though it’s possible to name a few people famous for their depictions of scientific discovery (Leonardo da Vinci comes to mind), illustrators rarely get their due. Their work is usually credited in tiny agate type buried in the margin of a page, not sitting in large type atop the article like writers’ bylines.
Yet without art, Science News would be a dreary place. And our ability to explain science would be sadly limited. Thank goodness illustrators take brush to paper (or these days, layering vector files in Adobe Illustrator) to help us see things we never could have envisioned without their help.